

Get 4.7× More Profit From Ads With Creative Lift Analysis for Analysts
Marketing analysts: use causal creative lift analysis to find high impact creative, then validate with quick A/Bs and prelaunch persona tests.

Creative lift analysis measures the incremental effect a specific ad creative has on brand or behavioral outcomes, isolated from everything else running in a campaign. Run one whenever you need to know if a creative caused a change, not just correlated with it. Success looks like a measurable, statistically sound gain in conversions, revenue, or brand metrics that you can attribute directly to the asset. Your next move: pick one primary metric and lock in a holdout group before the campaign launches, not after.
TL;DR:
- Creative lift analysis directly measures the causal impact of specific ad creatives on key outcomes, guiding budget allocation toward high-performing assets.
- Properly designed control groups, such as random audience holdouts or geo tests, are essential to obtain reliable and unbiased lift estimates.
- The primary KPIs should align with campaign goals: conversion rate or revenue for sales, and awareness or recall for brand campaigns, with measurement windows tailored to the sales cycle.
- Setting an appropriate minimum detectable effect and ensuring sufficient sample size before launch prevent underpowered tests and misleading results.
- Using pre-launch synthetic persona testing filters out weak creatives, reducing wasted media spend and increasing the efficiency of subsequent lift experiments.
Table of Contents
- What Is Creative Lift Analysis, Really?
- Why Lift Matters More Than Your Attribution Dashboard Admits
- How to Design a Test and Control Group That Actually Holds Up
- Which KPIs Actually Prove Creative Impact
- Getting the Statistics Right: Significance, Power, and Sanity Checks
- Turning Creative Elements Into Testable Variables
- From Lift Numbers to Creative Decisions
- Why Smart Teams Test Before They Spend a Dollar on Media
- Running Lift Tests Across Channels Without the Numbers Fighting Each Other
- What I’d Actually Tell an Analyst Starting This Today
- Test Creatives Before You Spend a Cent on Media
- Sources
- FAQ
What Is Creative Lift Analysis, Really?
Creative lift analysis isolates the causal effect of a specific ad, image, or video on a measurable outcome, comparing people exposed to it against a comparable group who weren’t. Conversion lift, brand lift, and engagement lift are the three variants you’ll run into most, and each answers a different question about the same creative.
Here’s how they break down:
- Conversion lift measures incremental purchases, signups, or revenue caused by the creative, typically using a holdout group that never sees the ad.
- Brand lift measures shifts in awareness, ad recall, or purchase intent, usually gathered through post-exposure surveys.
- Engagement lift measures behavioral signals like watch time, click-through, or scroll depth that hint at resonance before a purchase decision even happens.
If your campaign goal is bottom-funnel revenue, run conversion lift. If you’re launching a new product line or repositioning a brand, brand lift tells you more. If you’re iterating fast on creative variants and need a quick read before spending real budget, engagement lift (or a synthetic pre-test) gets you there faster.
The distinction that trips up most teams: lift is a causal metric, attribution is not. Attribution models assign credit across touchpoints based on rules or algorithms, but they can’t tell you what would have happened if the ad never ran. Lift analysis answers exactly that question, using a control group as the counterfactual. That’s why lift and attribution aren’t competing methods. They’re different tools for different questions, and conflating them is where most measurement programs go wrong.
Why Lift Matters More Than Your Attribution Dashboard Admits
Attribution models are built on correlation, and correlation has a blind spot: it can’t separate “this ad caused the sale” from “this ad happened to run while the sale was already coming.” Last-touch attribution routinely credits the cheapest, most frequent touchpoint (often a retargeting ad shown to someone who was already converting) while starving the upper-funnel creative that actually built the intent. Multi-touch models improve on this slightly but still can’t account for media overlap, where the same user sees three of your ads across two platforms and the model has no reliable way to split credit.
The consequences show up in budget decisions. A brand that trusts attribution alone will often overfund retargeting and underfund the awareness creative doing the real work, because attribution simply can’t see what didn’t happen — a challenge addressed by practical conversion rate optimization tips that help teams translate creative lift into actual conversion improvements. That’s a direct line to wasted spend, and it’s a big part of why less than a quarter of marketers use any single tech-enabled tool specifically for creative measurement, according to a joint report from Google and Kantar. Most teams know creative quality drives performance. Very few have a reliable way to prove which creative, specifically, did the driving.
Lift analysis fills that gap by design. It doesn’t ask “which touchpoint gets credit,” it asks “what changed because this creative existed.” That makes it a natural complement to marketing mix modeling and brand tracking rather than a replacement for either. MMM tells you how channels perform in aggregate over time; brand tracking tells you how perception is trending; lift analysis tells you whether a specific creative moved the needle. Run all three together and you get a measurement stack with far fewer blind spots than any one method alone.
How to Design a Test and Control Group That Actually Holds Up
A lift test is only as good as its design. Get the control group wrong and every downstream number is noise dressed up as insight. Start with a simple checklist before you touch a spreadsheet:
- Write the hypothesis first. State exactly what you expect the creative to move and by how much, before you see any data. “This video ad increases 7-day conversion rate among new visitors by at least 3 percentage points” is testable. “This ad should perform better” is not.
- Define your population. Decide whether you’re testing at the user level, the household level, or the geographic level, and be explicit about who’s eligible for inclusion.
- Choose your unit of randomization. This determines whether you split individual users, entire zip codes, or media markets, and it has to match how your media actually gets delivered.
- Plan your sample size before launch. Underpowered tests produce lift numbers that look real but collapse the moment someone checks the confidence interval.
With the checklist done, pick the design that fits your budget and platform constraints. A randomized audience holdout is the gold standard when your ad platform supports it: you split a comparable audience into exposed and unexposed groups at random, then compare outcomes. It’s clean, but not every platform offers true user-level randomization, and privacy changes have made this harder every year.
A geo holdout sidesteps that problem by turning off media in a set of matched regions while running normally everywhere else. It’s the go-to when your ad platform can’t do individual-level holdouts, or when you’re testing something like a TV or out-of-home creative where user-level targeting doesn’t exist. The tradeoff is statistical power: fewer geographic units means you need a bigger effect size to detect anything with confidence.
A synthetic control builds a statistical stand-in for your test region using a weighted combination of untreated regions, useful when you can’t depend a clean physical holdout at all. It’s more model-dependent than a real holdout, which means it should be treated as a first-pass signal rather than a final verdict.
Staggered rollouts, where you launch the creative in phases across regions or segments, give you a built-in comparison between “already launched” and “not yet launched” groups, useful for large rollouts where a permanent holdout isn’t politically or operationally feasible.
Watch for contamination: audience overlap between test and control, media bleed across geographic borders, and platform targeting changes mid-test that quietly break your randomization. When a true experiment isn’t possible, causal-inference models built on your observational data can still produce usable estimates. The catch is that they demand more rigor to trust, which is exactly the challenge the causal inference pipeline described by CreativeLift was built to solve.
Pro Tip: If your platform’s built-in lift tool locks you into its own attribution logic, run a parallel geo holdout on the side. It’s slower, but it’s the only way to sanity-check a black-box result against something you fully control.
Which KPIs Actually Prove Creative Impact
Your primary KPI should match the campaign objective, not whatever number is easiest to pull. For conversion-focused campaigns, that’s usually conversion rate (CVR) or revenue per user, measured as the incremental difference between exposed and holdout groups. For brand campaigns, aided or unaided awareness and ad recall are the standard primary metrics, typically gathered through post-exposure surveys run against both groups.
Emotional response and ad liking sit in between as intermediate signals. They won’t close a sale by themselves, but they’re leading indicators of what’s coming. Campaign evaluation frameworks that combine surveys, emotional analytics, and sales data show that shifts in ad liking map to measurable downstream effects: Nepa’s benchmark analysis found that emotion-driven creative changes correlate with measured activation increases of about 7–16% in case datasets across purchase intent and visit metrics. That’s a real enough signal to justify tracking ad liking as more than a vanity metric.
The stakes are higher than most teams assume. Kantar’s analysis, cited in the same Google-Kantar research, found high-quality creative can drive up to 4.7 times more profit than weaker creative running the same media plan. Creative quality isn’t a soft variable sitting next to your media mix. It’s often the single biggest lever in the model.
A few more considerations that separate a useful lift program from a sloppy one:
- Measurement window matters as much as the metric itself. A 7-day window catches impulse purchases but misses considered ones; a 30-day window catches more of the funnel but adds noise from other campaigns running concurrently.
- Delayed conversions need a defined cutoff. Decide upfront how long you’ll wait for a conversion to count, and apply that cutoff consistently across test and control.
- Benchmark against your own history, not industry averages. A 2% lift might be excellent for your category and mediocre for someone else’s. Your past campaigns are the only fair comparison set you have.
Getting the Statistics Right: Significance, Power, and Sanity Checks
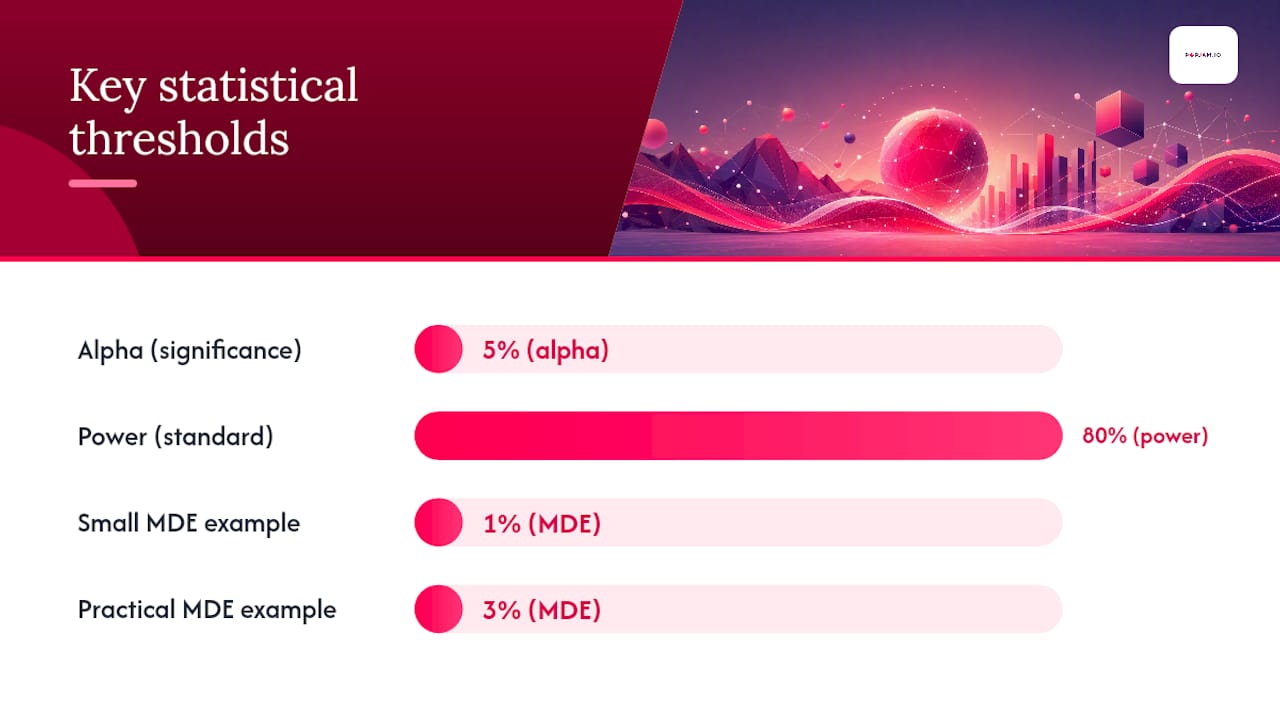
Set your alpha (typically 0.05) and your minimum detectable effect (MDE) before you launch, not after you see the results. The MDE is the smallest lift you actually care about detecting. If a 1% lift wouldn’t change any decision you’d make, don’t design a test sensitive enough to detect it. Set the MDE to the threshold that matters for your budget, then work backward:
- Estimate your baseline conversion rate from historical data for the same audience and channel.
- Calculate required sample size using your baseline rate, MDE, alpha, and desired statistical power (0.80 is standard, meaning an 80% chance of detecting a real effect if one exists).
- Check your available traffic against that number before committing to a launch date. If you can’t hit the sample size in a reasonable window, widen the MDE or extend the test period rather than launching underpowered.
- Account for channel-specific latency. Search and email conversions often resolve within hours; social and video ads can take days as consideration builds, so your conversion window needs to match the channel’s natural sales cycle, not a one-size-fits-all default.
Once you have a lift number, don’t take it at face value; stress-test it. Refutation tests are the standard check here: run a placebo treatment on a group that received no real exposure and confirm the model shows no lift where none should exist. Subset validation checks whether the effect holds up consistently across different segments of your data rather than being driven entirely by one outlier group. The CreativeLift causal pipeline applies exactly this combination, using double machine learning for the effect estimate and refutation tests to confirm it isn’t an artifact of the model specification.
Converting a statistical effect into business value is the last step, and it’s where a lot of good analysis gets buried in a slide nobody reads. Multiply the lift percentage by your baseline volume and average order value to get a dollar figure, then compare that against the media spend required to achieve it. A 3% lift on a $2 million campaign is a very different story than a 3% lift on a $50,000 test, even though the percentage looks identical on a chart.
Turning Creative Elements Into Testable Variables
Creative features become useful data once you can extract them systematically and treat them as variables in a model. The features worth pulling depend on format, but the recurring ones across most video and image analysis are consistent: face presence and prominence, product visibility and screen time, on-screen text size and duration, pacing (cuts per second, scene length), and music tempo or presence. Each of these has a plausible mechanism for influencing attention or emotional response, which is why they show up repeatedly in creative-effectiveness research rather than being arbitrary choices.
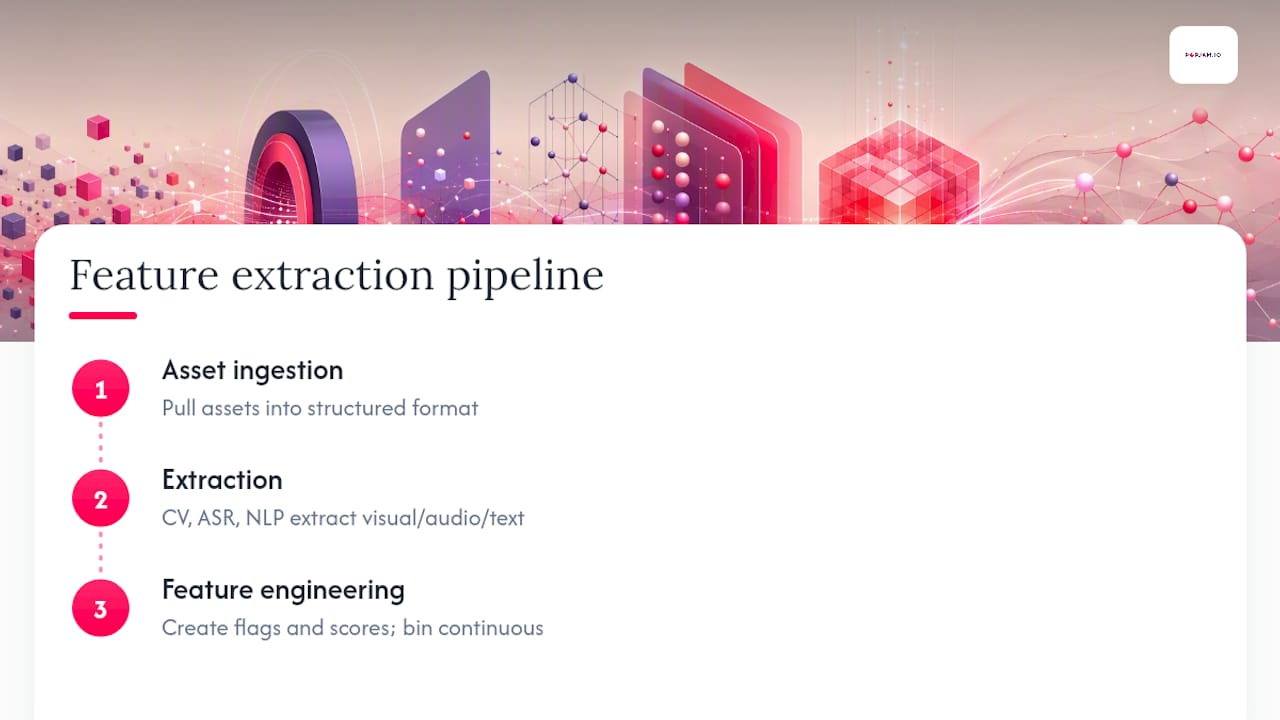
The pipeline itself typically runs in three stages. First, asset ingestion, where video, image, and audio files get pulled into a structured format. Second, extraction, using computer vision for visual elements, automatic speech recognition for spoken content, and natural language processing for on-screen or spoken text. Third, feature engineering, where raw extraction outputs get converted into variables a model can actually use, like a binary flag for “face visible in first three seconds” or a continuous score for “average shot length.”
Continuous features often get binned into categories (short, medium, long pacing, for example) so you can estimate a conditional average treatment effect for each bin rather than assuming a single linear relationship across the whole range. This matters because creative effects are rarely linear. A pacing increase might help engagement up to a point and then hurt comprehension past it, and a linear model would average those two effects into a meaningless flat line.
Covariate selection is where a lot of these models quietly fail. If you don’t control for confounders like media placement, audience targeting, or time of year, you risk attributing an effect to a creative feature when the real driver was where or when the ad ran. Double machine learning handles this by using flexible models to control for a large set of covariates before estimating the treatment effect, which is precisely why it has become the standard approach for creative feature analysis rather than simpler regression.
From Lift Numbers to Creative Decisions
A lift result only matters once you translate it into a decision. Start with three questions for every finding: how big is the effect, how confident are you in it, and how much would it cost to act on it? A large effect with a wide confidence interval is a hypothesis worth testing further, not a directive to overhaul your creative strategy tomorrow.
A simple prioritization matrix helps here, ranking each finding across three dimensions:
- Impact: the size of the lift and its estimated dollar value.
- Confidence: the statistical certainty behind the estimate, including whether it survived refutation testing.
- Implementation cost: how much production effort it takes to act on the finding, from a quick text swap to a full reshoot.
High impact, high confidence, low cost findings go straight into the next creative brief. High impact, low confidence findings become the next A/B test, not an immediate rollout. The gap between “the model suggests this” and “we’ve confirmed this” is exactly where a quick validation experiment earns its keep, and pairing modeled insights with direct testing closes that gap faster than waiting for the next full campaign cycle.
Pro Tip: Never present a lift number to stakeholders without its confidence interval sitting right next to it. A headline “12% lift” sounds decisive; “12% lift, 95% CI of 2% to 22%” sounds honest, and it’s the version that won’t blow up in a follow-up meeting.
When reporting to stakeholders, lead with the business impact in dollars, follow with the confidence level in plain language, and close with the specific creative action you’re recommending. Skip the methodology unless someone asks.
Why Smart Teams Test Before They Spend a Dollar on Media
Synthetic persona pre-testing has become the step that happens before a lift test even starts. Instead of waiting for a live campaign to tell you a creative underperforms, teams run the asset against simulated audience personas built from psychographic and behavioral data, catching weak creative before it burns a single dollar of media budget. It won’t replace a real lift test, but it dramatically cuts down how many mediocre variants ever reach that stage.
A practical version of this is a five-check pre-launch scorecard: does the creative clearly communicate the core message, does it match brand voice, does it evoke the intended emotional response, does the call-to-action stand out, and does it hold attention through the critical first few seconds? Assets that fail two or more checks rarely justify a media spend, let alone a full lift test.
Folding these pre-launch signals into your lift test selection means you’re only running expensive, time-consuming experiments on creative that already cleared a quality bar. That’s the shift happening across the industry: automated pre-launch scorecards are turning creative evaluation from a boutique research exercise into a standard part of the production workflow. If you want a deeper walkthrough of the mechanics, POPJAM’s guide on testing ad creatives before launch covers the workflow in more detail.
Running Lift Tests Across Channels Without the Numbers Fighting Each Other
Each channel comes with its own measurement quirks, and pretending they’re interchangeable is how cross-channel lift programs fall apart. Search and paid social often report conversions within hours; TV and out-of-home can take days to show up in behavior, which means your test duration has to flex by channel rather than following one fixed calendar.
Format matters just as much as channel. A six-second bumper ad and a two-minute brand video are measuring fundamentally different things, so lumping them into one lift test with a single primary metric usually produces a muddy result that satisfies nobody.
Decide upfront whether you need channel-level holdouts or a single systemwide experiment. If you’re testing one creative running identically across Meta, TikTok, and Google, a systemwide geo holdout is usually cleaner than trying to isolate each platform separately. If you’re testing platform-specific creative variants, you need channel-level holdouts to know which version is actually doing the work.
A short checklist keeps cross-channel contamination in check: confirm your holdout regions aren’t being reached through a different channel running unrelated creative, verify frequency caps are consistent across test and control, and check that no other team launched a promotion in your holdout region mid-test. That last one sounds obvious until it happens to you.
What I’d Actually Tell an Analyst Starting This Today
The teams getting this right aren’t choosing between pre-launch testing and lift experiments. They’re running both, in sequence, and treating the pre-launch scorecard as a filter that makes the lift test worth running in the first place. Skip pre-testing and you’re spending real media budget finding out what a synthetic audience could have told you in an afternoon.
If you’re starting from zero, don’t try to build a full measurement stack this quarter. Run one geo holdout on your next creative launch, pair it with a simple pre-launch scorecard, and see how often the scorecard predicts the lift result. That correlation, once you have it, tells you exactly how much weight to put on pre-testing going forward, and it’s worth more than any dashboard you’ll build this year.
— Doruk
Test Creatives Before You Spend a Cent on Media
Every design choice covered above (holdouts, sample size, refutation tests) exists because running lift tests on weak creative wastes budget you can’t get back. POPJAM flips that order: it generates on-brand ad creative and runs it against synthetic buyer personas that simulate real audience reactions, so you find out what resonates before a single impression goes live, not after your holdout group has already been exposed to it.
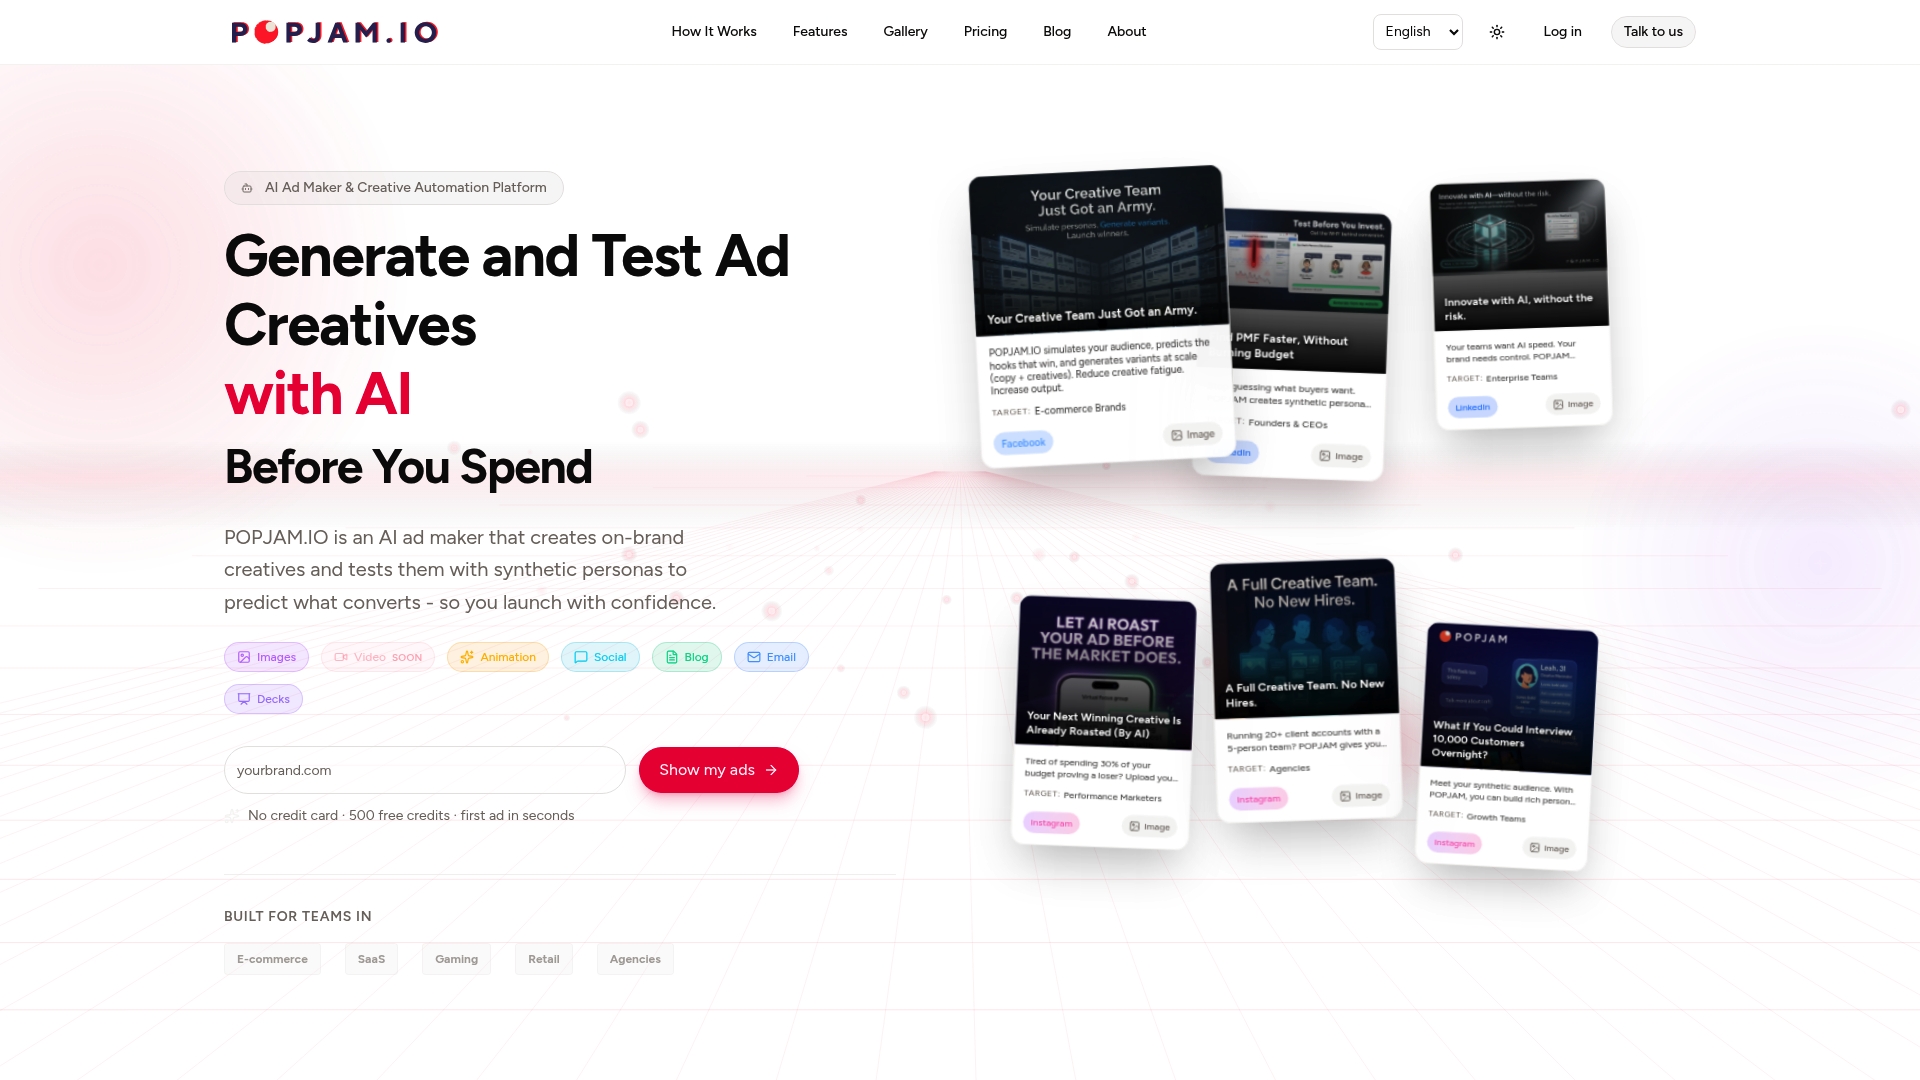
That means your lift program only spends real media dollars testing creative that already cleared a quality bar, which is exactly the pre-launch discipline described above. The platform covers images, video, animation, and social formats across Meta, Google, TikTok, LinkedIn, and Reddit, so the same pre-testing logic applies no matter which channel you’re planning to run your next holdout test on. Plans start with a Free tier, and paid options range from Starter to Business, with full details on the POPJAM pricing page. If you’re ready to see how synthetic persona feedback performs against your own creative, the AI ad maker is the place to start.
Sources
- New report shows how AI can close the creative measurement gap
- Campaign Evaluation: How to Measure True Marketing Impact
- Causal Inference in Practice at CreativeLift: Finding Creative Insights for Video Ads
FAQ
What Is the Difference Between Lift Analysis and Attribution?
Lift analysis measures causal impact using a control group as a counterfactual, while attribution assigns credit across touchpoints based on correlation and rules, without knowing what would have happened absent the ad.
How Long Should a Creative Lift Test Run?
It depends on your channel and conversion cycle. Search and email often resolve within days, while video and social campaigns typically need a longer window to capture delayed conversions and account for statistical power.
What Sample Size Do I Need for a Valid Lift Test?
It’s determined by your baseline conversion rate, minimum detectable effect, and desired statistical power (typically 0.80), calculated before launch rather than estimated after the fact.
Can I Run Lift Analysis Without a Big Testing Budget?
Yes. Geo holdouts and synthetic controls both let you estimate lift without platform-level randomized testing, and pre-launch synthetic persona testing through a tool like POPJAM can filter weak creative before you spend on any live test at all.
How Much Does POPJAM Cost?
POPJAM offers a Free plan, with paid tiers starting at Starter for 29 € per month, Essential at 99 € per month, and Business at 399 € per month, listed on the POPJAM pricing page.