

Marketing Experimentation Tools Test Ads With Synthetic Personas First
Compare marketing experimentation tools, assess demos, and build a sound testing program. See how synthetic personas can screen ad creative before launch.

Pair an experimentation platform with pre-launch creative validation, and use POPJAM to test ad creatives against synthetic buyer personas before they ever reach live traffic. Disciplined testing is linked to measurably higher revenue. Below we cover tool categories, an evaluation checklist, trust checks, and a rollout playbook.
TL;DR:
- Small teams or single channel programs can use point tools; steady traffic, concurrent tests, and product experiments favor a full stack platform.
- Choose one primary metric, set the run length and audience segments before launch, and investigate sample ratio mismatch before trusting results.
- During a 90 day pilot, validate tracking with an A/A test, run three experiments, then document decisions and promote winners by weeks 11 to 13.
- Use synthetic personas to rank concepts and identify objections, but confirm finalists with live randomized tests because simulation cannot provide the final causal answer.
Table of Contents
- Which categories of marketing experimentation tools exist?
- How do you evaluate an experimentation tool in a demo or trial?
- How do you read vendor comparison grids without being fooled?
- Do you need a full-stack platform or a set of point tools?
- What methodology and trust checks should every team run?
- How do you stand up an experimentation program in 90 days?
- How do you simulate synthetic buyer personas inside an experiment?
- What do case studies of improved ad performance tell us?
- What privacy and compliance rules apply to marketing experiments?
- How should you interpret psychographic feedback data?
- How do you reduce creative fatigue through experimentation?
- Why does creative pre-testing cut ad spend waste?
- Where does POPJAM fit in your experimentation program?
- FAQ
- Sources
Which categories of marketing experimentation tools exist?
“Experimentation tool” covers a lot of ground, and picking the wrong category is a common way teams waste time. Start with the job you need done, then match the category.
- A/B testing and landing page tools. Marketer-facing editors that split traffic between a control and variants on web pages, forms and email. Best for headline, layout and offer tests where you want results without waiting on engineering. They usually plug into your analytics suite, tag manager and CRM.
- Full-stack and feature experimentation platforms. Engineering-first systems that run experiments in your product code, on the server, in mobile apps and across channels. Best for pricing tests, onboarding flows, recommendation logic and anything that changes what the product does rather than how a page looks. They typically integrate with data warehouses and event pipelines.
- Feature flag tools. Switches that let you roll out a change to a slice of users and roll it back instantly. Many full-stack platforms bundle flags, but flags alone give you control over exposure, not statistical answers.
- Behavioral analytics, session replay and heatmaps. These tell you why a variant behaved the way it did. They rarely decide winners on their own, but they generate the hypotheses that feed your backlog, and they explain surprising results afterward.
- Experiment management and workflow tools. Backlogs, prioritization scoring, documentation and decision logs. Useful once you run more than a handful of tests at a time and need institutional memory.
- Creative pre-testing. This is the category most programs skip. Instead of spending live budget to learn that an ad concept fails, you validate concepts first. Our platform generates on-brand ad creatives and tests them against synthetic buyer personas, simulating audience reactions before launch. It fits ads on Meta, Google, TikTok, LinkedIn and Reddit, and it sits upstream of every other category on this list.
The practical split: marketer-facing tools (page editors, creative pre-testing, analytics) let a growth team move fast on its own, while engineering-first platforms (full-stack, flags) demand developer time but unlock tests on the product itself. Most healthy programs use one tool from each side and connect them through shared event data.
How do you evaluate an experimentation tool in a demo or trial?
Work through the list in this order. Early items are cheap to check and eliminate vendors fast.
- Data and integration fit. Ask the vendor to show a live connection to your analytics, warehouse and ad platforms. A good answer is a working demo with your own data schema, not a slide of logos. Red flag: “we can build that custom.”
- Assignment and tracking reliability. Ask how users are bucketed and how the tool keeps a person in the same variant across sessions and devices. A good answer names the identifier used and explains what happens when cookies are cleared.
- Statistical engine. Ask whether the tool uses Frequentist or Bayesian methods, how it handles peeking, and whether it corrects for multiple comparisons. A good answer is specific and explains the tradeoffs. Red flag: “our engine just tells you when you have a winner.”
- Trust checks built in. Ask whether the tool flags sample ratio mismatch automatically and supports A/A tests. A good answer shows the alert in the interface.
- Variance reduction. Ask about CUPED or similar techniques, and whether they cost extra. Variance reduction can improve sensitivity, but it often requires enterprise-tier access or data engineering work, so you want to know that before you sign.
- Segmentation and targeting. Ask how you slice results by audience, device or channel, and whether slicing is corrected for false positives. A good answer warns you about the risk of cutting data until something looks significant.
- Governance and promotion workflow. Ask how a winning variant becomes production code or a live campaign. A good answer includes approvals, documentation and rollback.
- Pricing shape. Surface this before the final round. Ask what the metered unit is (monthly tracked users, events, experiments, seats), what happens when you exceed it, and which features sit behind higher tiers.
Pro Tip: Bring a real past test to every demo and ask the vendor to set it up live. Watching someone configure your actual use case reveals more than a slide presentation.
Pricing questions deserve their own pass. Traffic-based pricing punishes growth, seat-based pricing punishes collaboration, and flat tiers often hide the features you need above the entry plan. Ask for a written quote at a higher volume so you see what scaling costs.
How do you read vendor comparison grids without being fooled?
Comparison tables are written by marketers, and the columns are usually chosen to flatter the author. Here is what each common axis actually means and how to verify it.
- Best for. A positioning claim, not a measurement. “Best for enterprise” often means “sales-led pricing and a long implementation.” Translate it by asking for a customer of your size and asking what they run on it.
- Pricing shape. The metered unit and the tier gates, covered above. A low entry price with a steep jump to the plan that includes your must-have features is a common pattern. Ask for the feature list by tier in writing.
- Integrations. A logo on a grid can mean a native, bidirectional connection or a one-way CSV export. Test it: send an event from the source system and confirm it arrives where you expect, with the fields you need.
- Statistical engine and trust features. “Advanced statistics” is not a feature. Ask for the method name, whether sequential testing is supported, and whether SRM detection is on by default. Expert practitioners at Microsoft, Google and LinkedIn stress testing for assumption violations and avoiding traps such as Twyman’s Law, where a striking pattern turns out to be a measurement artifact or outlier.
- Deployment mode. Client-side tools modify the page in the browser and are fast to launch but can flicker and are exposed to ad blockers. Server-side tools decide the variant before the page renders and are more robust but need developers. Match the mode to who will run the tests.
- Rollout control. Look for gradual rollout options, kill switches and targeting rules. If a vendor cannot show you an instant rollback, assume it does not exist.
- Personalization. Often a separate module with separate pricing. Modern approaches use adaptive experiments and contextual bandits to shift traffic toward better performers, which speeds learning but changes how you read results. Ask whether the tool reports a clean lift estimate or just routes traffic.
- Scale and enterprise readiness. Look for SSO, audit logs, role-based permissions and data residency options. For a small team these are noise; for a regulated company they are gating items.
Vendor tiers deserve a final reality check. Map each tier to your volume, your engineering capacity and the concurrent tests you realistically expect. Buy for near-term needs, not an expansive vision on the sales deck. A team running a modest number of tests does not need a platform built for thousands of experiments annually, and a team that pays for unused enterprise features is spending budget it could have put into creative production.
One more habit that pays off: write down the three decisions the tool must help you make, then judge every grid cell against those decisions. Anything that does not move one of the three is a nice-to-have, and nice-to-haves are how evaluation processes drag on for months.
Do you need a full-stack platform or a set of point tools?
Neither is better in the abstract. The answer depends on a handful of signals.
- Traffic. Low traffic limits the number of tests you can finish at all. If you can only complete a few meaningful tests a quarter, a full-stack platform will sit underused, and pre-testing creative before live traffic becomes even more valuable.
- Concurrent experiments. Running many overlapping tests demands interaction checks and a central view of exposure. That favors a platform.
- Engineering bandwidth. No developer time means marketer-facing point tools. Dedicated engineers mean server-side experiments are on the table.
- Need for feature flags. If product releases are a core use case, a platform that bundles flags and experiments saves integration work.
- Appetite for integrated analytics. Teams that want one source of truth for exposure and outcomes lean toward a platform; teams happy with their existing warehouse can stitch point tools together.
Adopt a full-stack platform when you have steady traffic, several people launching tests, and product changes you want to measure rigorously. Stay with point solutions when one channel dominates your growth, your team is small, or you are still proving that experimentation pays off internally.
Where does creative pre-testing fit? In both. With a full-stack platform, it filters the ad concepts you feed into live tests, so the platform measures finalists instead of first drafts. With point tools, it acts as your first line of defense: you validate concepts with synthetic personas, then run only the survivors in the ad platform’s own split testing. Either way, it shortens the path from idea to a decision you can trust, and our guide on how to test ad creatives before launch walks through the mechanics.
A final signal worth weighing is organizational. If several departments will share the tool, the cost of a fragmented stack rises quickly because nobody can see what everyone else is testing. If a single growth team owns the work, lighter tools with clear ownership usually win on speed.
What methodology and trust checks should every team run?
Start with the metric. The Overall Evaluation Criterion (OEC) is the single primary measure that decides whether a variant wins. Pick one because multiple headline metrics invite cherry-picking: with enough metrics, something will always look good. The practitioner literature behind trustworthy online controlled experiments treats a well-defined OEC as foundational, and the statistical review of A/B testing methodology describes the same culture: decisions grounded in data, investment in people and infrastructure, and comfort with a high rate of failed ideas.
Then run the technical checks before you believe any result:
- Sample ratio mismatch (SRM). If the actual counts drift beyond what chance explains, something is broken in assignment or tracking. Discard the result and investigate.
- A/A tests. Run two identical variants to confirm your setup does not manufacture winners. A tool that “finds” a difference between identical experiences has a problem.
- Run-length rules. Decide the duration or sample size in advance and cover full weekly cycles. Stopping the moment a chart turns green is the fastest route to false positives.
- Variance reduction. CUPED uses pre-experiment behavior to tighten estimates, so you reach a decision with less traffic. Check whether your tool supports it.
- No p-hacking. Do not slice results after the fact until a segment looks significant. Pre-register the segments you care about.
Misreading p-values is a common failure. Many teams misinterpret p-values and ship false positives, which is why we recommend writing the decision rule down before launch, not after.
Governance keeps all of this durable. Keep a hypothesis backlog where every idea states the change, the expected effect and the reason you believe it. Score ideas with ICE (impact, confidence, ease) so the loudest voice does not set priorities. Structured testing programs with hypothesis backlogs and ICE prioritization produce more reliable lift than ad hoc tests, and they pair best with incrementality checks and clear promotion rules. Our framework for proving creative testing ROI with incrementality and kill/keep rules shows how to set those rules for ad creative specifically, and our creative testing framework covers the surrounding process.
How do you stand up an experimentation program in 90 days?
You do not need a large team. You need clear roles and a short, disciplined pilot.
Minimal team. One owner (a growth or marketing lead) who runs the backlog and signs off on decisions. One analyst or data-minded marketer who validates setup and reads results. One creative producer who ships variants. One engineer, even part-time, who handles tracking and any server-side work. In a very small team one person wears several hats, but the roles should still be named.
The pilot sequence.
- Pick the OEC and baseline (weeks 1 to 2). Choose the single metric that matters, confirm it is tracked accurately, and run an A/A test to validate the setup.
- Run three experiments (weeks 3 to 10). Choose tests with different risk profiles: one low-effort page or message test, one creative test on ads, and one test of a bigger idea. Give each enough time to cover full weekly cycles and hit its planned sample size.
- Graduate the winners (weeks 11 to 13). Document results, ship what won, retire what lost, and write down what you learned. Then refill the backlog from the findings.
- Review the program itself. Count how many tests finished cleanly, how many ideas moved from backlog to decision, and how long each cycle took. Those numbers tell you whether to scale.
Operating-model advice from agencies that scale brands is useful here, particularly on staffing; this D2C marketing agency playbook describes systems that separate scaling brands from stalled ones.
Promotion checklist before shipping a winner:
- The result passed SRM and ran for its planned duration.
- The OEC moved in the expected direction, and guardrail metrics did not degrade.
- The effect is large enough to matter commercially, not merely statistically significant.
- The change is documented, with a rollback plan.
- Someone owns monitoring after launch.
Pro Tip: Budget for the boring parts. Plan for tracking cleanup and an A/A test before interpreting results. Teams that skip this step may end up arguing about whether their numbers can be trusted.
For small teams that want to test creative before spending, our pre-launch creative testing playbook maps this pilot onto an ad workflow.
How do you simulate synthetic buyer personas inside an experiment?
Synthetic personas are modeled audience profiles that react to your creative the way a defined buyer segment might. The aim is not to replace live tests but to stop obviously weak concepts from consuming budget.
A workable method has four steps. First, define the segments you actually sell to, using attributes such as goals, objections, price sensitivity and the platforms they use. Second, build personas from those attributes, grounded in your own customer data and research rather than guesses. Third, present each creative to each persona and collect both quantitative signals (which concept ranks higher) and qualitative feedback (what the persona noticed, doubted or ignored). Fourth, iterate: revise the weakest concepts and retest until the finalists clear your threshold.

In our platform, this runs before launch, so the output is a shortlist of creatives with reasons attached. Treat the results as strong directional evidence for ranking concepts, then confirm the finalists with a live test. The simulation narrows the field; the live experiment still delivers the final, causal answer.
What do case studies of improved ad performance tell us?
Read case studies for the pattern, not the headline number. The consistent story across serious programs is volume and rigor: the organizations that benefit most run large numbers of tests and treat every result, including failures, as input. The book on trustworthy online controlled experiments notes that leaders such as Booking.com and Amazon run thousands of experiments annually, and that mature programs compound small gains into meaningful revenue growth.
For ad teams, the transferable lesson is about cycle time. Programs that improve ad performance tend to share three habits: they test one meaningful variable at a time, they kill losing creatives quickly under rules set in advance, and they feed what they learn into the next round of production. Pre-testing speeds the second habit, because weak concepts are eliminated before they spend.
Be skeptical of any case study that omits the baseline, the sample size or the test duration. If you cannot reconstruct how the result was measured, you cannot reproduce it. Build your own internal case studies instead: log each test with its hypothesis, setup, result and decision, and review them quarterly. After a few cycles, your own archive becomes the most persuasive evidence in the building.
What privacy and compliance rules apply to marketing experiments?
Experiments touch personal data at three points: assignment (which variant a person sees), measurement (what they do afterward) and audience building (who gets targeted). Each needs a lawful basis and honest disclosure.
Start with consent. If your tool sets cookies or identifiers to keep people in a consistent variant, your consent banner and privacy policy need to reflect that. Collect only the data the OEC and guardrails require, and set retention limits so test data does not linger indefinitely. Check where your vendor stores and processes data, and ask for a data processing agreement. Be careful with sensitive categories; testing on health, financial or children’s data brings stricter obligations.
Synthetic personas change the picture usefully. Because pre-launch simulation uses modeled audiences, you can learn how a concept might land without exposing real individuals to unfinished creative or collecting their data in the process. Our simulation approach is built to be GDPR-compliant. Even so, the live confirmation tests still need standard consent and disclosure practices, and your legal counsel should confirm what applies in your markets.
Document your decisions. A short record of what data each experiment collects, why, and for how long makes audits and vendor reviews far easier.
How should you interpret psychographic feedback data?
Psychographic feedback describes why people respond, covering motivations, values, fears and attitudes, rather than just who they are demographically. It is rich, and it is easy to over-read.
Begin by separating patterns from anecdotes. One persona’s comment is a hypothesis; the same objection raised across several personas is a signal. Group feedback into themes such as price doubt, trust gaps, unclear benefit or message mismatch, and count how often each theme appears per creative.
Next, connect themes to specific creative elements. If personas repeatedly say a headline feels vague, change the headline and retest, rather than rewriting the whole ad. This keeps your next round of changes small enough to learn from.
Then check the feedback against behavior. Stated reactions and real actions often diverge, so use psychographic data to decide what to test live, not to declare winners. Finally, watch for your own bias: it is tempting to quote the comments that confirm what you already believed. Write down, before reading the feedback, what result would make you change your mind.
How do you reduce creative fatigue through experimentation?
Creative fatigue sets in when the same audience sees the same ad too often and response declines. Experimentation turns that from a vague worry into a managed process.
- Test concepts, not just tweaks. Swapping a button color rarely refreshes an audience. Vary the angle, the hook, the format and the proof point.
- Keep a rotation pipeline. Pre-test new concepts continuously so replacements are ready before performance drops, not after.
- Set refresh triggers. Decide in advance which signals (rising frequency, falling click-through or conversion rate) prompt a swap, and write the kill/keep rules down.
- Retire on rules, not feelings. Pause a creative when it crosses the threshold, not when someone gets bored of it.
- Reuse what wins. When a concept works, extract the principle (the objection it answered, the format that held attention) and build variants around it.
Platform-native exports and automated generation make it practical to keep a steady supply of on-brand variants, which is the real cure: fatigue is a supply problem as much as a measurement problem.
Why does creative pre-testing cut ad spend waste?
Most of the money lost in advertising is lost on ideas that never had a chance. Live testing is a wonderful way to find the winner among decent options, but it is an expensive way to discover that a concept is weak. Every dollar spent proving a bad ad is bad is a dollar that could have funded a better test.
That is why I push for validation before live traffic. When you simulate how defined buyer segments react, you shorten the experimentation cycle: weak concepts fall out in hours, and the live test gets a stronger field. You still need the rigor described above, with an OEC, trust checks and promotion rules. Pre-testing does not replace them; it feeds them better material.
The approach that has made the most difference for the teams we work with is the combination. Use an experimentation platform to measure real outcomes, and use creative validation to decide what deserves to be measured. If you want to see how this plays out in practice, our blog playbooks on testing ad creatives before launch and the creative testing framework are the resources I would start with.
— Doruk
Where does POPJAM fit in your experimentation program?
We built POPJAM to be the creative validation layer of the program described above. It generates on-brand ad creatives, tests them against synthetic buyer personas before they go live, and returns psychographic feedback so you can see what resonates with each segment and why. Exports are platform-native, so a validated concept moves straight into Meta, Google, TikTok, LinkedIn or Reddit without a rebuild.
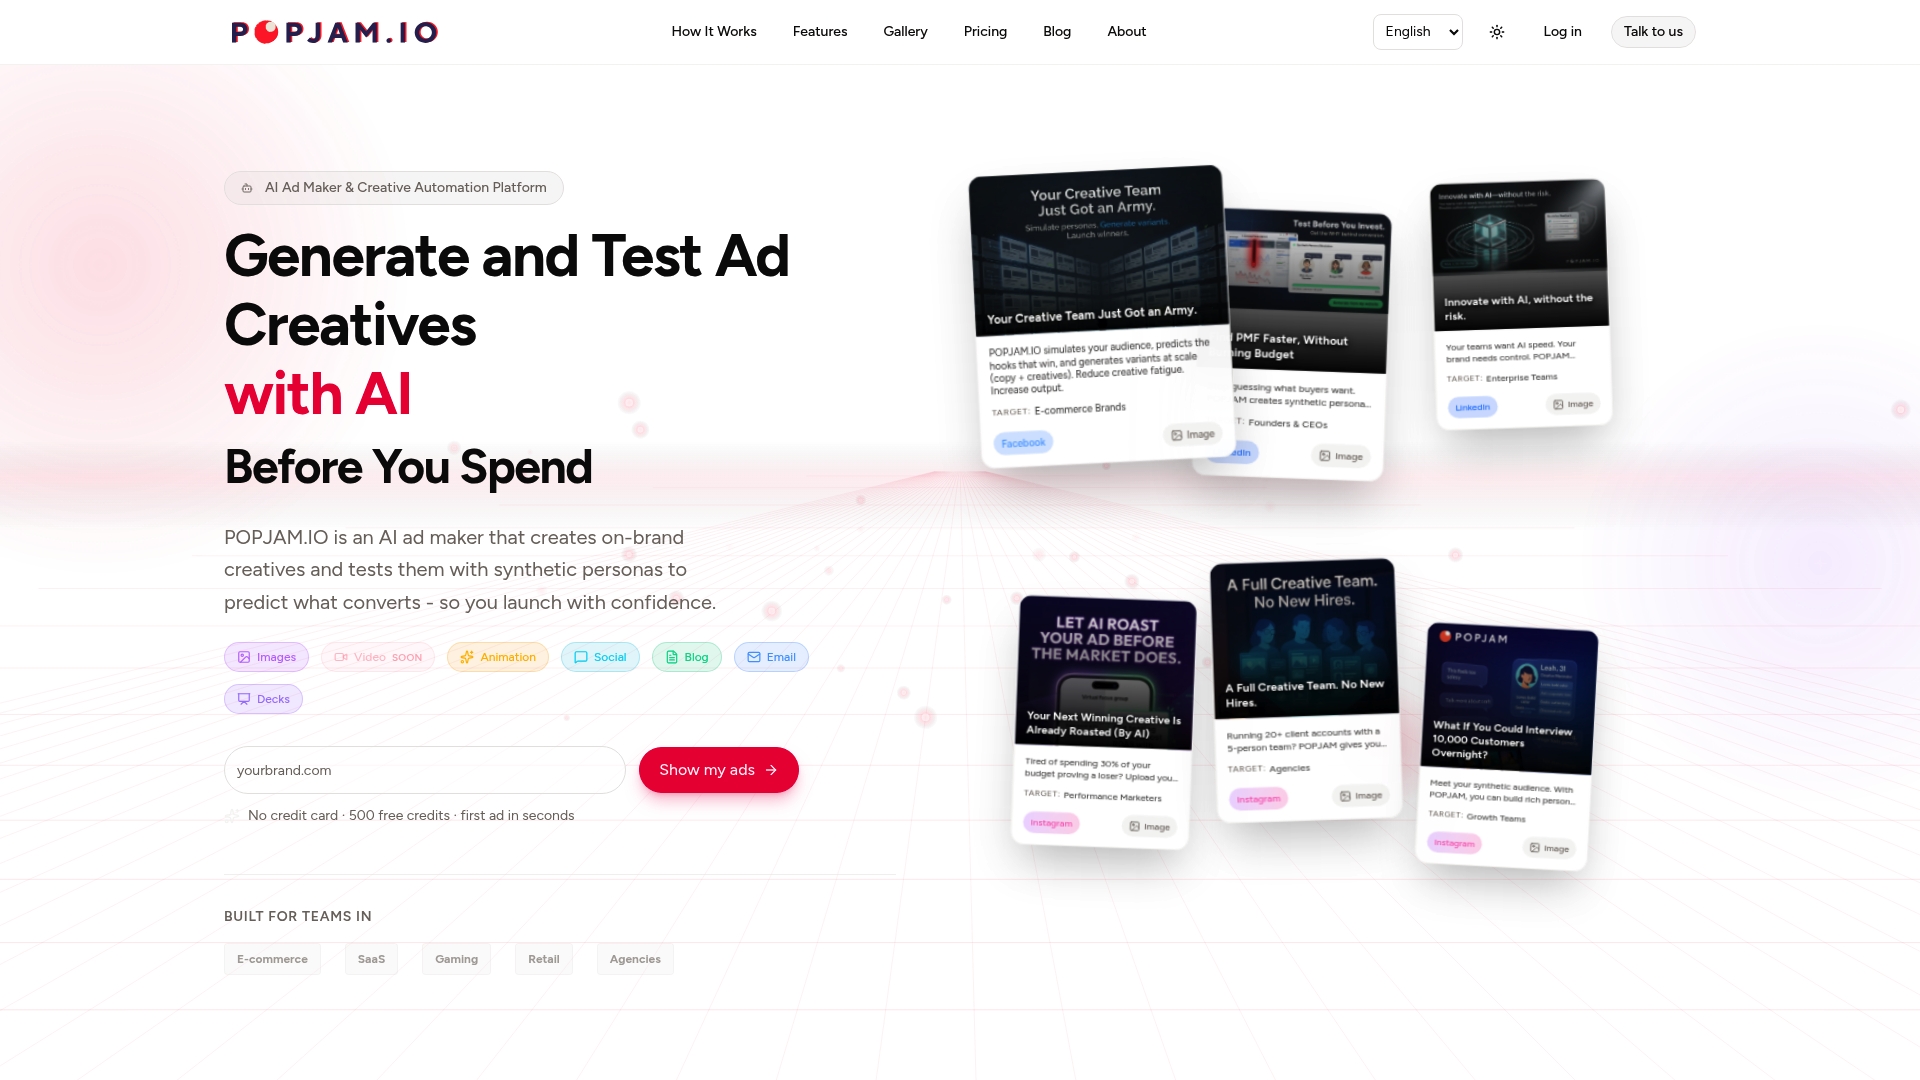
Our AI ad generator lets you see this in action: bring a concept, generate variants, and watch how different personas react. If you are weighing cost, our pricing page lists every plan. A Free plan lets you try the platform first. Paid plans are Starter at 29 € per month, Essential at 99 € per month and Business at 399 € per month, with Enterprise pricing available on request. If you need more generation capacity, credit packs run from 1,000 Credits at 10 € one-off up to 10,000 Credits at 100 € one-off.
What to expect: you will set up your brand, generate a first batch of creatives, run them against personas, and get feedback. Treat that first batch as a pilot. Pick your strongest finalists, then send them into the live tests your experimentation platform manages. Start with the Free plan at Popjam and run your first pre-launch test today.
FAQ
What is A/B testing in analytics and how is it used?
A/B testing compares a control against one or more variants by randomly splitting traffic and measuring which performs better on a chosen metric. Teams use it to decide between page designs, messages, offers and ad creatives. It works as a risk-management exercise built on controlled experiments, replacing opinion with evidence.
What are marketing research tools?
Marketing research tools help you understand audiences and test ideas before and after launch. They include surveys, analytics platforms, heatmaps and session replay, experimentation platforms, and creative pre-testing tools that simulate audience reactions. The right mix depends on whether you need to find problems, generate hypotheses or confirm a decision.
What is an experiment in marketing?
A marketing experiment is a controlled test of one change, such as a new headline, audience or ad creative, against a baseline, with a metric and decision rule defined beforehand. Randomization is what separates an experiment from simply comparing last month to this month, because it isolates the change from everything else happening in the market.
What are the top marketing tools for experimentation?
Rather than one top ten, think in categories: an A/B testing tool for pages and messages, a full-stack or feature experimentation platform for product changes, analytics and replay tools for diagnosis, a workflow tool for your backlog, and a creative pre-testing tool such as ours for validating ads before launch. Choose by job to be done and team capacity.
Sources
- Trustworthy Online Controlled Experiments
- Arxiv
- Digital Marketing Optimization: 10 Best Strategies to Increase Marketing ROI