

2–4 Week Pilot: Pick Creative Analytics Platforms for Marketing Teams
Procurement checklist for marketing teams to evaluate creative analytics platforms. Learn what to demand from vendors, run a 2–4 week pilot, and stop...

Creative analytics platforms track which ad creatives work, why they work, and where they’re about to burn budget on fatigue. If your team is running more than a handful of creatives a week across two or more channels, you need one, and the checklist below will help you separate the platforms that just report numbers from the ones that actually help you win.
TL;DR:
- Creative analytics platforms should provide insights into why certain ad elements outperform others, not just report raw performance numbers.
- Effective platforms automatically tag creative components, aggregate cross-channel data, detect recurring success patterns, and support structured testing.
- Teams with fewer than 10 creatives per month, operating on a single channel or spending under $10,000 monthly, may not yet benefit from advanced creative analytics tools.
- Compatibility with your existing ad platforms, quality of analysis, measurement approach, operational fit, and clear governance are key factors to evaluate before purchasing.
- Combining pre-launch testing with AI-driven creative generation, as POPJAM does, offers a more comprehensive solution than analysis-only tools and yields faster, more reliable insights.
Table of Contents
- What Creative Analytics Platforms Actually Do
- When You Actually Need a Creative Analytics Platform
- How to Evaluate Creative Analytics Platforms: A Buyer’s Checklist
- Pricing and Budget Guidance for Creative Analytics Platforms
- Implementation and Timeline: What to Expect Before You See Results
- Measuring Impact: Predictive Signals vs Proof That It Worked
- The Research Behind AI-Driven Creative Optimization
- What Marketing Teams Consistently Get Wrong About This Category
- Why POPJAM Fits This Checklist Better Than a Standalone Analytics Tool
- Sources
- FAQ
What Creative Analytics Platforms Actually Do
Here’s the thing nobody tells you upfront: most “creative analytics” tools are really just dashboards with better filters. The real ones do something closer to diagnosis. Creative analytics refers to organized, systematic insights on your creative assets and ad groups, the kind that let you see performance patterns instead of just performance numbers.
That distinction matters because raw metrics tell you what happened. Analytics platforms are supposed to tell you why. Knowing that every ad using a testimonial-style hook outperforms product-shot openers by a wide margin is an insight you can act on.
Here’s what the good platforms are built to do:
- AI-driven element tagging. The platform breaks each creative into components (hook, visual style, CTA phrasing, color palette) and tags them automatically, so you can compare performance at the element level instead of just the asset level.
- Cross-platform aggregation. It pulls creative-level data from Meta, TikTok, Google, and other channels into one normalized view, so you’re not manually reconciling spreadsheets from five ad managers.
- Pattern detection. Instead of a wall of numbers, it surfaces the recurring traits behind your winners and losers, like “UGC-style videos under 15 seconds are your best-performing format this quarter.”
- Testing orchestration. Some platforms go further than analysis and actually help you structure and launch creative tests, not just report on ones you ran manually.
- Integrations with your existing stack. Look for native connections to ad platforms, data warehouses, and commerce tools like Shopify, since creative performance means nothing in isolation from revenue data.
That last point is where a lot of teams get tripped up. A platform that shows you engagement metrics but cannot tie a creative back to actual purchases is only giving you half the picture. You want the tool that connects “this hook drove clicks” to “this hook drove revenue.”
There’s also a meaningful split in the market between analysis-only tools and platforms that combine generation with testing. Product glossaries and explainers note that creative analytics can live in either camp: pure measurement layers that sit on top of creatives you’ve already made, or end-to-end systems that help you build and validate creatives before they ever hit a live account. Which camp you need depends heavily on how your team currently produces creative, and that’s worth sitting with before you evaluate a single vendor.
If your creative team is already fast and prolific but flying blind on performance data, an analysis-only tool might be all you need. If your bottleneck is actually creative production, and you’re spending on assets that never had a real shot at working, a platform that generates and pretests creative earns its keep differently. We’ll get into that distinction more when we talk about fit.
One more thing worth knowing before you start vendor calls: the AI layer in these tools isn’t magic. Its pattern recognition trained on your historical performance data, which means the platform is only as sharp as the volume and quality of creative history you feed it. A brand launching its first ten ads will get thinner insights than one with two years of creative history across multiple channels. That’s not a dealbreaker, but it should shape how much weight you put on early recommendations.
When You Actually Need a Creative Analytics Platform
Not every team needs this yet, and that’s fine to say out loud. Buying a creative analytics platform before you have the creative volume to feed it is like hiring a data scientist to analyze three data points. Here’s how to know if the timing is right.
- Check your creative cadence. If you’re shipping fewer than five to ten new creatives a month, you likely don’t have enough volume for pattern detection to say anything reliable yet. Wait until you’re producing at a steadier clip.
- Look at your channel spread. Running ads on one platform is manageable with native reporting. The moment you’re live on two or more channels (say Meta and TikTok, or Google and Reddit), manual creative comparison becomes a real time sink, and that’s your signal.
- Match spend to solution category. Teams spending under $10,000 a month typically do fine with lighter, self-serve tools, while those in the $10,000 to $50,000 range start to benefit from mid-market platforms with deeper integrations, according to industry spend-band comparisons. Spend above that tends to justify enterprise-grade platforms with dedicated support.
- Assess your team’s technical bandwidth. If you don’t have a data engineer and your analytics team is already stretched, prioritize platforms with strong native integrations and low-code setup over ones that require custom pipeline work.
- Consider your use case. A DTC Shopify brand chasing repeat purchase rate needs different creative signals than a mobile app team optimizing for install-to-purchase conversion, or an agency managing creative programs across a dozen client accounts. Your use case should shape which features you prioritize, not just which platform has the flashiest dashboard.
If you’re nodding along to three or more of these, it’s time to start evaluating. If you’re nodding along to one, it’s worth revisiting in a quarter.
How to Evaluate Creative Analytics Platforms: A Buyer’s Checklist
This is the part that actually saves you money. Most teams pick a platform based on the demo, get charmed by a slick UI, and figure out three months later that it doesn’t connect to half their stack. Here’s what to ask instead, organized by category.
Data connectivity and ownership. Before anything else, confirm the platform actually talks to the channels you run ads on.
- Which ad platforms does it natively support, and does that include the ones where you spend the most (Meta, Google, TikTok, LinkedIn, Reddit)?
- How does it handle pixel data and SKAdNetwork constraints on mobile, since Apple’s privacy framework changes what’s measurable at the individual level?
- Can it write processed data back into your own warehouse, or does your data live only inside their dashboard?
Analytic model quality. This is where vendors love to wave their hands, so push for specifics.
- How accurate is the element tagging, and can you audit or correct tags the AI gets wrong?
- Can the vendor explain why the AI is recommending a particular creative direction, or is it a black box?
- Is the platform genuinely detecting patterns across your creative history, or is it just surfacing correlations that might not hold up (a common and costly distinction)?
Measurement approach. This is the single most overlooked category, and it’s where a lot of platforms quietly fall short.
- Does the platform support real experiments, like holdout tests, or does it rely entirely on observational data?
- Ask directly whether it supports causal measurement methods versus predictive indicators alone. A platform that only shows correlation between a creative element and a metric is not the same as one that can tell you the element caused the lift.
- If it claims incrementality measurement, ask how, since methods like Predicted Incrementality by Experimentation require training on a real corpus of randomized-control trials to produce trustworthy estimates.
Operational fit. A powerful platform your team won’t actually use is worse than a simple one they will.
- How fast does data refresh, and does that latency match your decision-making cadence?
- Is the interface built for a data analyst, or can a creative director or media buyer navigate it without training?
- Does it support role-based access and collaboration features, so creative, UA, and analytics teams aren’t stepping on each other?
Commercial and legal questions. Save these for last, but don’t skip them.
- Is pricing transparent and tied to something predictable (seats, spend, creative volume), or does it require a custom quote for basic tiers?
- Are there implementation or onboarding fees on top of the subscription?
- What’s their data privacy posture, and do they support the compliance requirements your region and industry demand?
Pro Tip: Ask every vendor for one specific example of a creative decision their platform changed for an existing customer. If they can only talk in generalities, that tells you something about how mature their analytics really are.
Run through this list on every vendor call, and you’ll walk away from most demos with a much clearer sense of who’s selling substance and who’s selling a nice UI.
Pricing and Budget Guidance for Creative Analytics Platforms
Pricing in this category is all over the map, and vendors structure it in ways that make apples-to-apples comparison genuinely hard. Knowing the common shapes helps you cut through the noise fast.
- Per-seat pricing charges by the number of users who need platform access, which works well for small, focused teams but gets expensive as you scale collaborators.
- Per-account pricing charges based on the number of ad accounts connected, common for agencies managing multiple clients.
- Creatives-based pricing scales with volume of assets analyzed or generated, which rewards lean creative teams and penalizes prolific ones.
- Spend-banded pricing ties cost to your monthly ad spend, a model many platforms favor because it scales revenue with customer value.
- Enterprise and custom pricing covers dedicated support, custom integrations, and service-level guarantees, typically requiring a sales conversation rather than a published rate.
According to market comparisons of creative analytics tools, entry-level solutions tend to serve teams spending under $10,000 monthly, mid-market platforms cluster around the $10,000 to $50,000 spend band, and enterprise tools typically serve accounts spending $250,000 or more. Those bands aren’t rigid, but they’re a useful starting filter before you get on a call.
Watch for costs that don’t show up on the pricing page. Professional services for setup, custom connector builds, and training sessions can add real money on top of the subscription line, especially with enterprise contracts. Always ask what’s included versus billed separately.
Run that exercise with your own numbers before you sign anything, and be honest about how conservative your lift assumption really is.
Implementation and Timeline: What to Expect Before You See Results
Setting expectations early saves you a lot of frustration later. Here’s the honest sequence.
- Connect your ad accounts and data sources first. This is non-negotiable groundwork: link Meta, Google, TikTok, or whichever platforms you run, plus your warehouse or commerce platform if the tool supports it.
- Clean up your creative metadata and naming conventions. Most platforms can only tag and compare creatives as well as your naming allows. If your ad names are a mess of random file titles, expect weaker pattern detection until you standardize.
- Run a pilot before going to production. Turnkey SaaS platforms typically deliver a usable dashboard in two to four weeks, while enterprise implementations with custom services can take six to twelve weeks or more, so pick your pilot scope accordingly.
- Confirm you have enough creative volume for reliable insights. Pattern detection needs a real sample to work with. A handful of creatives won’t give the platform enough signal, so plan your pilot around a period where you’re already running a reasonable number of variants.
- Anticipate integration friction. Broken pixels, inconsistent naming across channels, and platform-specific data limits (especially on mobile, given SKAdNetwork constraints) are the most common blockers. Flag these with your vendor’s onboarding team early rather than discovering them mid-pilot.
The teams that get value fastest are the ones who treat onboarding as a real project, not an afterthought. Assign someone to own the connector setup and naming cleanup before the pilot clock starts, and you’ll avoid burning your first month on plumbing instead of insights. For teams building this muscle for the first time, practical guidance on integrating AI into creative operations can help you sequence the rollout without overwhelming your team.
Measuring Impact: Predictive Signals vs Proof That It Worked
Here’s where a lot of teams get fooled by their own dashboards. A platform showing you strong CTR, CVR, CPM, and ROAS by creative is genuinely useful, but those are predictive indicators, not proof of causation. A creative can show a great CTR simply because it happened to run to a warmer audience segment, not because the creative itself was better.
Track these at the creative level as your baseline signals:
- Click-through rate and conversion rate, which show engagement and intent by specific creative.
- CPM and ROAS, which tie creative performance back to media efficiency and revenue.
- Revenue by creative, when your platform can connect ad-level data to actual purchase data.
Predictive metrics tell you where to look. They don’t tell you what actually caused the result. That’s the gap causal methods are built to close. Randomized-control trials and holdout experiments remain the gold standard: split your audience, run one creative against a holdout, and measure the real difference. The catch is that RCTs are expensive and slow to run at scale for every creative decision.
This is where newer methods try to bridge the gap without demanding a full experiment every time. Predicted Incrementality by Experimentation trains a predictive model on a corpus of past RCTs, then applies that model to estimate incremental effects for campaigns that never ran a formal experiment, a method already used in production by large advertising platforms.
Predicted Incrementality by Experimentation offers a middle path between full RCTs and observational guesswork, provided you have a representative training corpus of prior experiments to calibrate against. That’s a real technical requirement, not a formality, so ask any vendor claiming incrementality measurement how their model was trained and validated.
The practical workflow: use your platform’s diagnostics to spot promising patterns, run small RCTs to confirm the strongest candidates actually cause the lift you think they do, then scale the confirmed winners with confidence. Skip the confirmation step, and you’re just trusting correlation.
The Research Behind AI-Driven Creative Optimization
Let’s talk about what’s actually been proven here, because the marketing around “AI creative optimization” moves faster than the evidence usually does.
Peer-reviewed research gives us a real anchor point. A study published in Marketing Science tested a framework combining generative AI with an active learning loop in a live advertising campaign. The result: creatives produced through this framework achieved a higher mean click-through rate and lower variance than creatives designed by professional human designers or by AI models optimized purely for aesthetics.
A live-campaign study found that generative AI paired with active learning outperformed both human-designed and unguided AI creatives on click-through rate, with more consistent results across the tested batch. That consistency matters as much as the raw lift, since it means fewer wasted impressions on underperforming variants during the discovery process.

What makes this approach practical rather than purely academic is the active learning piece. Rather than requiring massive labeled datasets upfront, the framework focuses training on the most informative creative batches, which the research suggests makes data-driven creative optimization workable for smaller advertisers, and not just brands with huge historical datasets.
That’s the theory. On the applied side, POPJAM.IO reports a notable increase in ROI for performance marketers using its pre-launch testing and synthetic persona feedback. That figure is a vendor-supplied data point rather than an independently audited benchmark and should be treated accordingly, but it signals that pretesting against simulated audience reactions before spend goes live can influence outcomes.
Generative AI combined with active learning can produce creatives that outperform both professional human designers and unguided AI models in live field tests.
Together, these findings point toward a sensible pilot design: don’t treat AI creative suggestions as gospel, and don’t dismiss them as gimmicks either. Use them to generate a shortlist of strong candidates, then validate the strongest ones with a real, if small, test before committing serious budget.
What Marketing Teams Consistently Get Wrong About This Category
If there’s one pattern worth calling out, it’s this: teams buy creative analytics platforms expecting them to replace judgment, and then get disappointed when the tool just organizes information instead of making decisions for them. That’s backward. The value isn’t the AI telling you what to do. It’s the AI narrowing a hundred possible creative directions down to five worth actually testing.
The bigger blocker isn’t the technology at all, it’s usually internal. Inconsistent creative naming, no shared taxonomy between the media buying team and the creative team, and no clear owner for the platform once the initial excitement wears off. I’ve seen more platforms fail from governance gaps than from any weakness in the underlying analytics.
The fix is almost boring in its simplicity: agree on a naming convention before you connect a single account, assign one person to own the platform relationship, and commit to running at least one confirmatory test per quarter instead of trusting predictive dashboards alone. Teams that do this get real value within a quarter. Teams that skip it end up with an expensive dashboard nobody opens by month four.
— Doruk
Why POPJAM Fits This Checklist Better Than a Standalone Analytics Tool
If you’ve worked through the checklist above, you’ve probably noticed a gap: most creative analytics platforms are analysis-only. They’ll tell you what worked after you’ve already spent the budget finding out the hard way. POPJAM takes a different route.
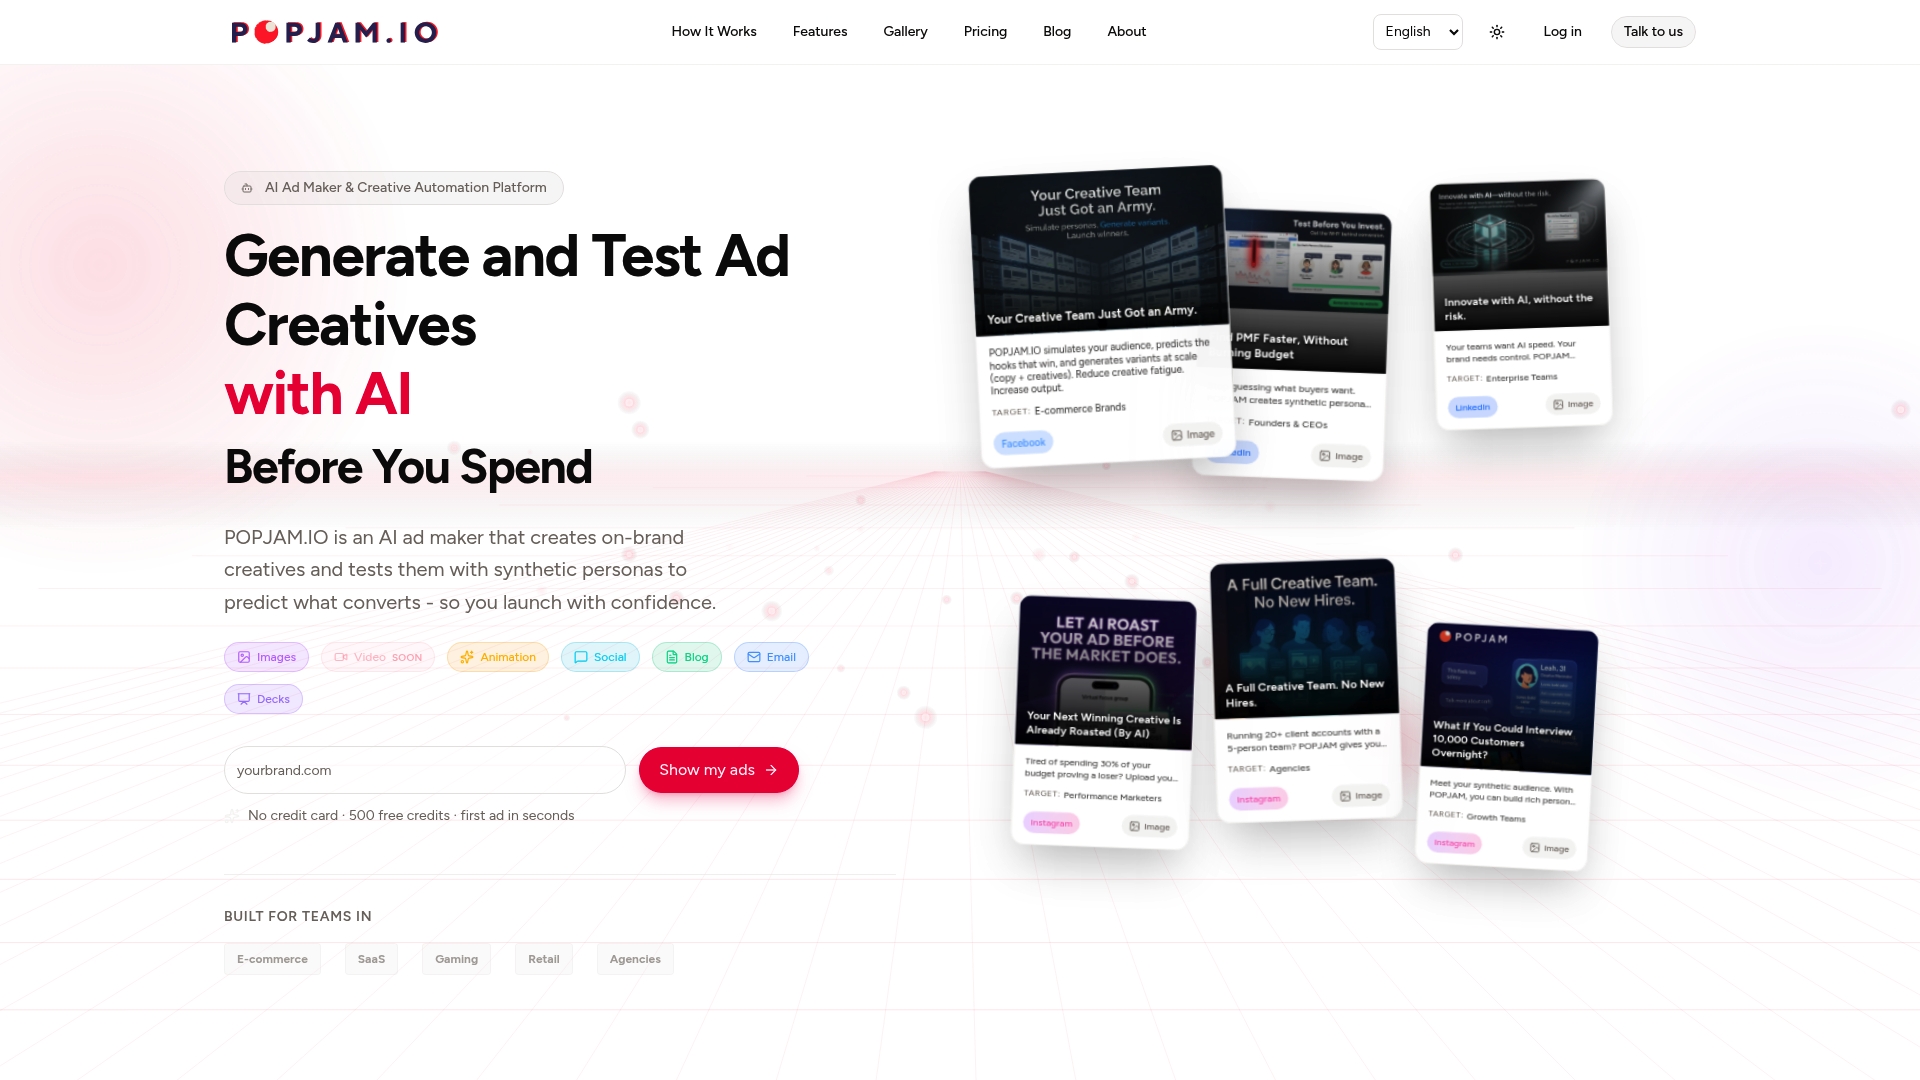
POPJAM combines AI-driven creative generation with pre-launch testing against synthetic buyer personas, so you get feedback on hooks, visuals, and messaging before a single dollar goes toward media spend. That covers the data connectivity, analytics, and testing orchestration criteria from the checklist in one workflow, rather than stitching together a generation tool and a separate measurement layer.
- Start free to explore the AI ad generator and see how synthetic persona feedback works on your own creative before committing budget.
- Scale with Starter, Essential, or Business plans, or add credit packs when you need extra generation capacity, with current prices listed on the pricing page.
- Export platform-native creative for major ad platforms once a concept tests well, so validated work moves straight into your existing media workflow.
If you’re ready to see how pre-launch testing changes your creative decisions, check current plans and pricing and start with a pilot batch this month.
Sources
The research and explainers below back the core claims in this article and are worth a closer read if you want to go deeper on any single point.
- Leveraging Generative Artificial Intelligence to Create Visual Content in Digital Advertising | Marketing Science
- 12 Best Creative Analytics Tools Compared (2026)
- Predicted Incrementality by Experimentation (PIE) for Ad Measurement
- What is creative analytics? - Singular
FAQ
What are examples of analytics platforms?
Creative analytics platforms range from analysis-only dashboards that aggregate performance data across ad accounts to end-to-end tools that combine AI creative generation with pre-launch testing, such as POPJAM. The right example for you depends on whether your bottleneck is measurement or creative production itself.
Which creative intelligence platform is considered the best?
There’s no single platform that wins for every team, since the right choice depends on your spend band, channel mix, and whether you need generation and testing or measurement alone. Platforms that combine pre-launch synthetic persona testing with analytics, like POPJAM, are a strong fit for teams that want to validate creative before spending on it.
What does creative analytics mean?
Creative analytics refers to organized, systematic data and insights on your ad creatives and ad groups that help you understand and improve performance, according to Singular’s glossary definition. It covers everything from element-level tagging to pattern detection across your creative history.
What are the top 5 digital marketing platforms?
This depends heavily on the specific function you need, since ad platforms (Meta, Google, TikTok), analytics tools, and creative platforms serve different jobs entirely. For creative-specific needs, evaluate options against a clear checklist covering data connectivity, measurement rigor, and operational fit rather than chasing a generic “top platforms” list.
How long does it take to see results from a creative analytics platform?
Turnkey SaaS platforms typically deliver a usable dashboard within two to four weeks, while enterprise implementations with custom services can take six to twelve weeks or more. Meaningful pattern detection also depends on having enough creative volume in your pilot period to generate a reliable sample.