

Fix Weak Hooks in 7–14 Days: Ad Creative Benchmarks for Ad Teams
Use channel and objective ad creative benchmarks plus 7–14 day reaction windows and sample size rules to design tests that scale and cut wasted spend.
Check your click through rate against your channel’s benchmark band first. If it lands in the “poor” range for your objective, your creative is the problem, not your targeting or bid strategy. Everything else in your account, from audience segments to bid caps, matters less than fixing the ad itself, and the fix usually takes one testing cycle if you follow the reaction windows below.
TL;DR:
- Creative testing should focus on opening frames, motion, and specific outcome-driven copy, as these elements consistently drive engagement across platforms.
- AI-generated assets can boost CTR but may not lead to conversions for high-value products without additional trust signals and refined messaging.
- Testing multiple ad variants, with sample sizes of hundreds to thousands of impressions, helps identify weaknesses before significant budget is wasted.
- Benchmark ranges vary by channel and objective; underperformance requires immediate creative adjustments rather than targeting or bid changes.
- Platforms reward different creative behaviors, making it essential to build native, optimized content for each network and to use pretesting tools to validate concepts beforehand.
Table of Contents
- What Are Good Ad Creative Benchmarks by Channel and Objective?
- How Do Ad Performance Benchmarks Differ by Platform?
- What Makes a Winning Ad Creative?
- How Many Ad Variants Should You Test, and How Fast Should You Act?
- How Do You Turn Benchmarks Into a Creative Testing Plan?
- Where Do Ad Creative Benchmark Numbers Come From?
- What Actually Moves the Needle on Creative Performance
- Test Creative Before It Costs You Real Budget
- Sources
- FAQ
What Are Good Ad Creative Benchmarks by Channel and Objective?
Every performance marketer eventually asks the same question: is this number actually good, or does it just feel good because it’s better than last month? The honest answer requires a formula, not a vibe.
Click through rate (CTR) is clicks divided by impressions, multiplied by 100. It’s the primary marker of creative relevance because it tells you whether the ad stopped the scroll before anything else happened.
Conversion rate is conversions divided by clicks. It tells you whether the people who stopped scrolling actually did something once they landed.
Cost per acquisition (CPA) is total spend divided by conversions. It’s the number that determines whether the campaign makes money.
Cost per mille (CPM) is cost per thousand impressions. It moves with competition, seasonality, and audience size, and it’s the metric most likely to spike without warning during Black Friday or Cyber Monday.
Return on ad spend (ROAS) is revenue divided by ad spend. For e-commerce accounts, this is usually the north star, though it can mislead you if your attribution window is too short or too long.
Here’s roughly how those metrics band out across the objectives most performance teams run:
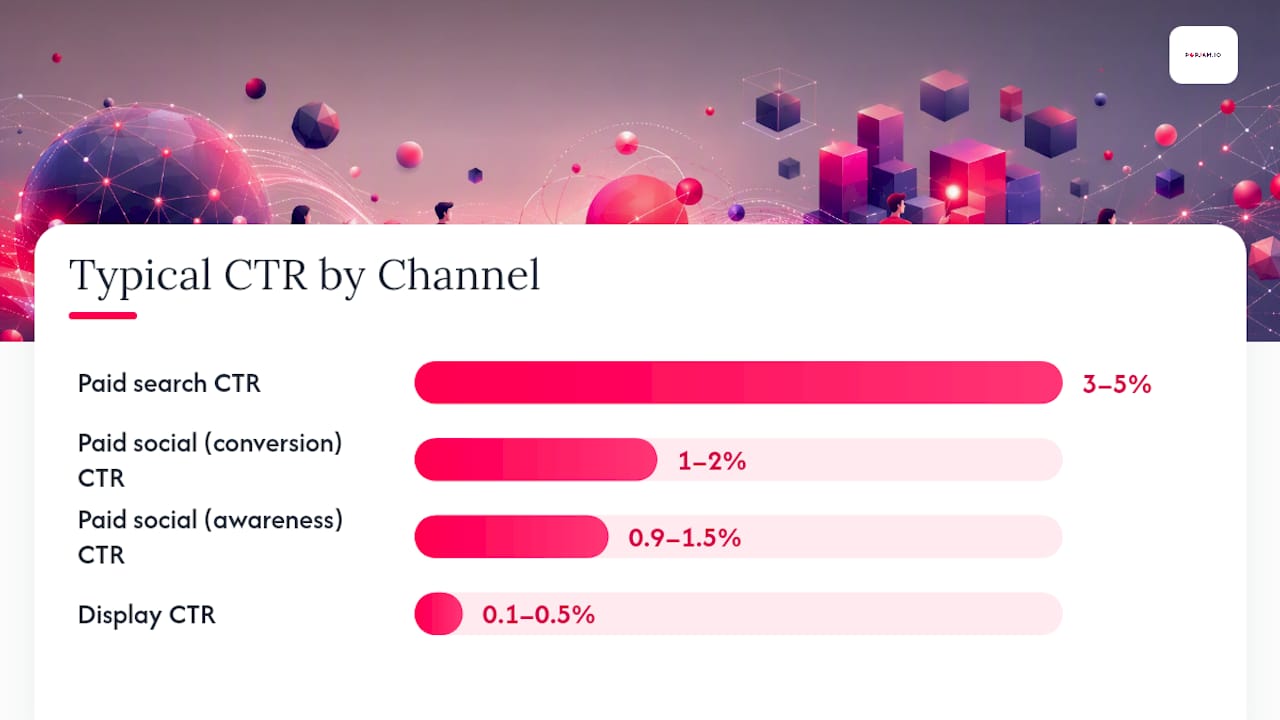
- Paid social, awareness objective: CTR of 0.9% to 1.5% is typical; below 0.5% signals creative fatigue or a weak hook.
- Paid social, conversion objective: CTR of 1% to 2%, conversion rate of 2% to 5%, CPA varies heavily by vertical.
- Paid search: CTR of 3% to 5% on well-matched keywords, conversion rate of 3% to 7% depending on intent.
- Display: CTR often sits under 0.5%, sometimes as low as 0.1%, because display is a low-intent placement by design.
- Video (paid social or YouTube): view through rate matters more than CTR in the first few seconds; completion rate past 3 seconds is a better early signal than clicks.
Advertising performance only means something when you measure it against the actual campaign objective. A 0.4% CTR on a display awareness campaign isn’t a failure. The same number on a paid-search conversion campaign is a five-alarm fire.
Pro Tip: Don’t compare your CPA across channels without adjusting for funnel stage. A cold-audience CTA at the top of funnel should never carry the same CPA target as a retargeting ad hitting warm cart abandoners.
If your objective is awareness, prioritize CTR and reach efficiency. If it’s conversion, prioritize conversion rate and CPA, and treat CTR as a diagnostic rather than the goal itself.
How Do Ad Performance Benchmarks Differ by Platform?
Meta, Google, TikTok, and programmatic display don’t just have different average numbers. They reward fundamentally different creative behaviors, and testing the same asset across all four without adjusting expectations wastes budget fast.
Meta feed placements tend to reward native looking content, the kind that doesn’t scream “ad” in the first frame. TikTok pushes that further: polished, brand-forward creative regularly underperforms rougher, creator-style footage because the algorithm and the audience both associate that texture with authenticity. Google Search operates on an entirely different logic since intent is already high before the ad appears, which is why Google Ads tracks a distinct set of columns, including average CPC and average CPM, to help advertisers separate reach efficiency from click efficiency. Display inventory, by contrast, is mostly a numbers game of scale and frequency rather than message resonance.
AI-generated creative complicates this picture in a useful way. Early signals suggest AI-generated assets can raise CTR by a real margin, largely because generative tools are fast at producing novel visual hooks that break pattern interrupts across a feed. But that CTR lift doesn’t always carry through to conversions, particularly for higher-AOV products where buyers need more trust signals than a single eye-catching frame can deliver. Treat AI creative as a rapid ideation engine and an attention-capture tool, not a guaranteed path to ROAS.
Practical implications for test design:
- Build platform-native variants instead of repurposing one asset everywhere; a TikTok-first hook rarely survives the jump to Google Display, untouched.
- For high-AOV products, pair AI-generated hooks with human-refined mid-funnel copy that addresses objections directly.
- Weight your test budget toward the channel where your objective actually lives, not where CPMs happen to be cheapest that week.
What Makes a Winning Ad Creative?
Look at any high-performing ad across accounts and verticals, and a handful of repeatable patterns show up again and again. None of them are complicated. Most teams just don’t test them deliberately.
The opening frame decides everything. You have roughly two seconds before someone’s thumb moves on. Ads that win tend to open on motion, a face, or an unexpected visual, never on a logo or a slow product pan. Static ads face the same clock in different form: the first thing the eye lands on has to answer “what is this” before it can answer “why should I care.”

Copy patterns that correlate with stronger engagement usually lead with a specific outcome or a direct question rather than a generic claim. “Lost 12 pounds in six weeks” beats “Get healthy fast.” A question that names the reader’s exact situation beats a broad statement about the category.
Format-specific rules matter more than people expect:
- Short video (under 15 seconds): front-load the hook in the first 2 seconds; captions should work with sound off since a large share of feed viewing happens muted.
- Static image: one focal point, minimal text overlay, product or benefit visible without cropping.
- Carousel: use the first card as the hook, not a table of contents, and let each subsequent card answer a specific objection.
- Search text ads: match headline language to the query itself; generic value propositions underperform specific, keyword-echoing headlines.
Google’s own creative guidance backs this up from a different angle, recommending marketers feed automated systems a genuinely diverse set of headlines and assets rather than minor variations of the same idea, since the algorithm can only find a winning combination if enough real variation exists to test.
Pro Tip: Write your hook five different ways before you touch the visuals. If none of the five feel distinct from each other, your visual variants probably won’t be either.
How Many Ad Variants Should You Test, and How Fast Should You Act?
Testing volume is where most accounts either waste budget chasing noise or leave money on the table by reacting too slowly. Both failure modes come from skipping the sample-size math.
Here’s a rough operating guide by account size:
- Small accounts (under $3,000/month): run 2 to 3 creative variants per ad set at a time. More than that splits your budget too thin to reach significance in a reasonable window.
- Mid-size accounts ($3,000 to $25,000/month): run 4 to 6 variants per campaign, rotating out the bottom performer every cycle rather than waiting for a full refresh.
- Large accounts ($25,000+/month): run 8 or more variants simultaneously, often across multiple creative concepts, since budget allows faster accumulation of statistically usable data.
Minimum sample-size thresholds vary by metric, but a workable rule of thumb requires hundreds to thousands of impressions and dozens of conversions before you can trust a CTR or conversion-rate difference between variants. Fewer than that, and you’re reading randomness as a trend.
That refresh cadence lines up with broader industry guidance recommending creative refresh roughly every 7 to 14 days for many paid-social campaigns, since audiences fatigue on the same creative faster than most teams assume. Acting before you hit the minimum data threshold is the single most common reason accounts kill a winning ad by mistake.
How Do You Turn Benchmarks Into a Creative Testing Plan?
Benchmarks are only useful once you turn them into a decision, not a data point you glance at and forget. Here’s the four-step framework worth running every time you audit a campaign.
- Pick the objective and its primary metric. Awareness campaigns live and die by CTR and reach efficiency. Conversion campaigns live and die by conversion rate and CPA. Don’t let a secondary metric distract you from the one that actually maps to the goal.
- Calculate the gap versus benchmark. If your paid-social conversion CTR sits at 0.6% against a typical band of 1% to 2%, you have a defined, measurable gap, not a vague feeling that “performance is soft.”
- Design prioritized tests around the gap. A CTR gap points to the hook and opening frame. A conversion-rate gap, with healthy CTR, points to landing page mismatch or weak mid-funnel copy, not the ad’s visual at all. A structured testing framework keeps this prioritization from turning into random guesswork.
- Measure with the correct window, using the sample-size thresholds above, before making a pause, scale, or refresh decision.
Pro Tip: Pause underperformers only after they clear the minimum conversion threshold for your tier. Killing an ad on day two because CTR looks soft is how good creative gets discarded before it ever had a fair test.
Surface metrics alone will mislead you here. Funnel-aware attribution is what tells you whether a high-CTR ad is actually driving revenue or just generating cheap, low-intent clicks that die at checkout.
Where Do Ad Creative Benchmark Numbers Come From?
Most published benchmark ranges come from two source types: platform-level analytics aggregated across large advertiser bases, and third-party reports that pool anonymized account data across verticals. Both are useful, but neither replaces your own account history.
- Watch for seasonality bias. Benchmarks pulled from a dataset that includes Black Friday and Cyber Monday will skew CPM higher and CTR lower than a typical month.
- Watch for vertical skew. A benchmark blended across fashion, SaaS, and financial services will not reflect your specific category’s baseline.
- Small accounts should widen their acceptable range around published benchmarks, since limited data volume means more natural swing month to month.
- Large accounts should treat published ranges as a floor, not a ceiling, since scale typically allows tighter optimization than the blended average suggests.
What Actually Moves the Needle on Creative Performance
Most teams treat benchmarks as a scoreboard instead of a diagnostic tool, and that’s backward. The number itself doesn’t matter nearly as much as the speed at which you can act on it.
The teams that consistently outperform their vertical’s benchmarks aren’t the ones with the biggest budgets. They’re the ones who’ve shortened the distance between “this creative might be weak” and “we know exactly why, and we’ve already got the next test running.” That requires testing velocity most accounts don’t have, because most accounts are still validating creative live, with real money, in front of real audiences.
AI creative tools deserve real credit for ideation speed, but treat the CTR lift with appropriate suspicion until conversion data confirms it. A hook that stops the scroll and a message that closes the sale are two different problems, and generative tools are currently better at the first one than the second.
The real ROI case for creative analytics and pretesting isn’t abstract. It’s the difference between discovering a weak hook after $2,000 in wasted spend versus discovering it before a single impression served.
— Doruk
Test Creative Before It Costs You Real Budget
Some ad-testing platforms generate on-brand ad creative and run it against synthetic buyer personas that simulate audience reactions, providing psychographic feedback on a hook, a headline, or a full ad concept before it ever touches a live campaign.
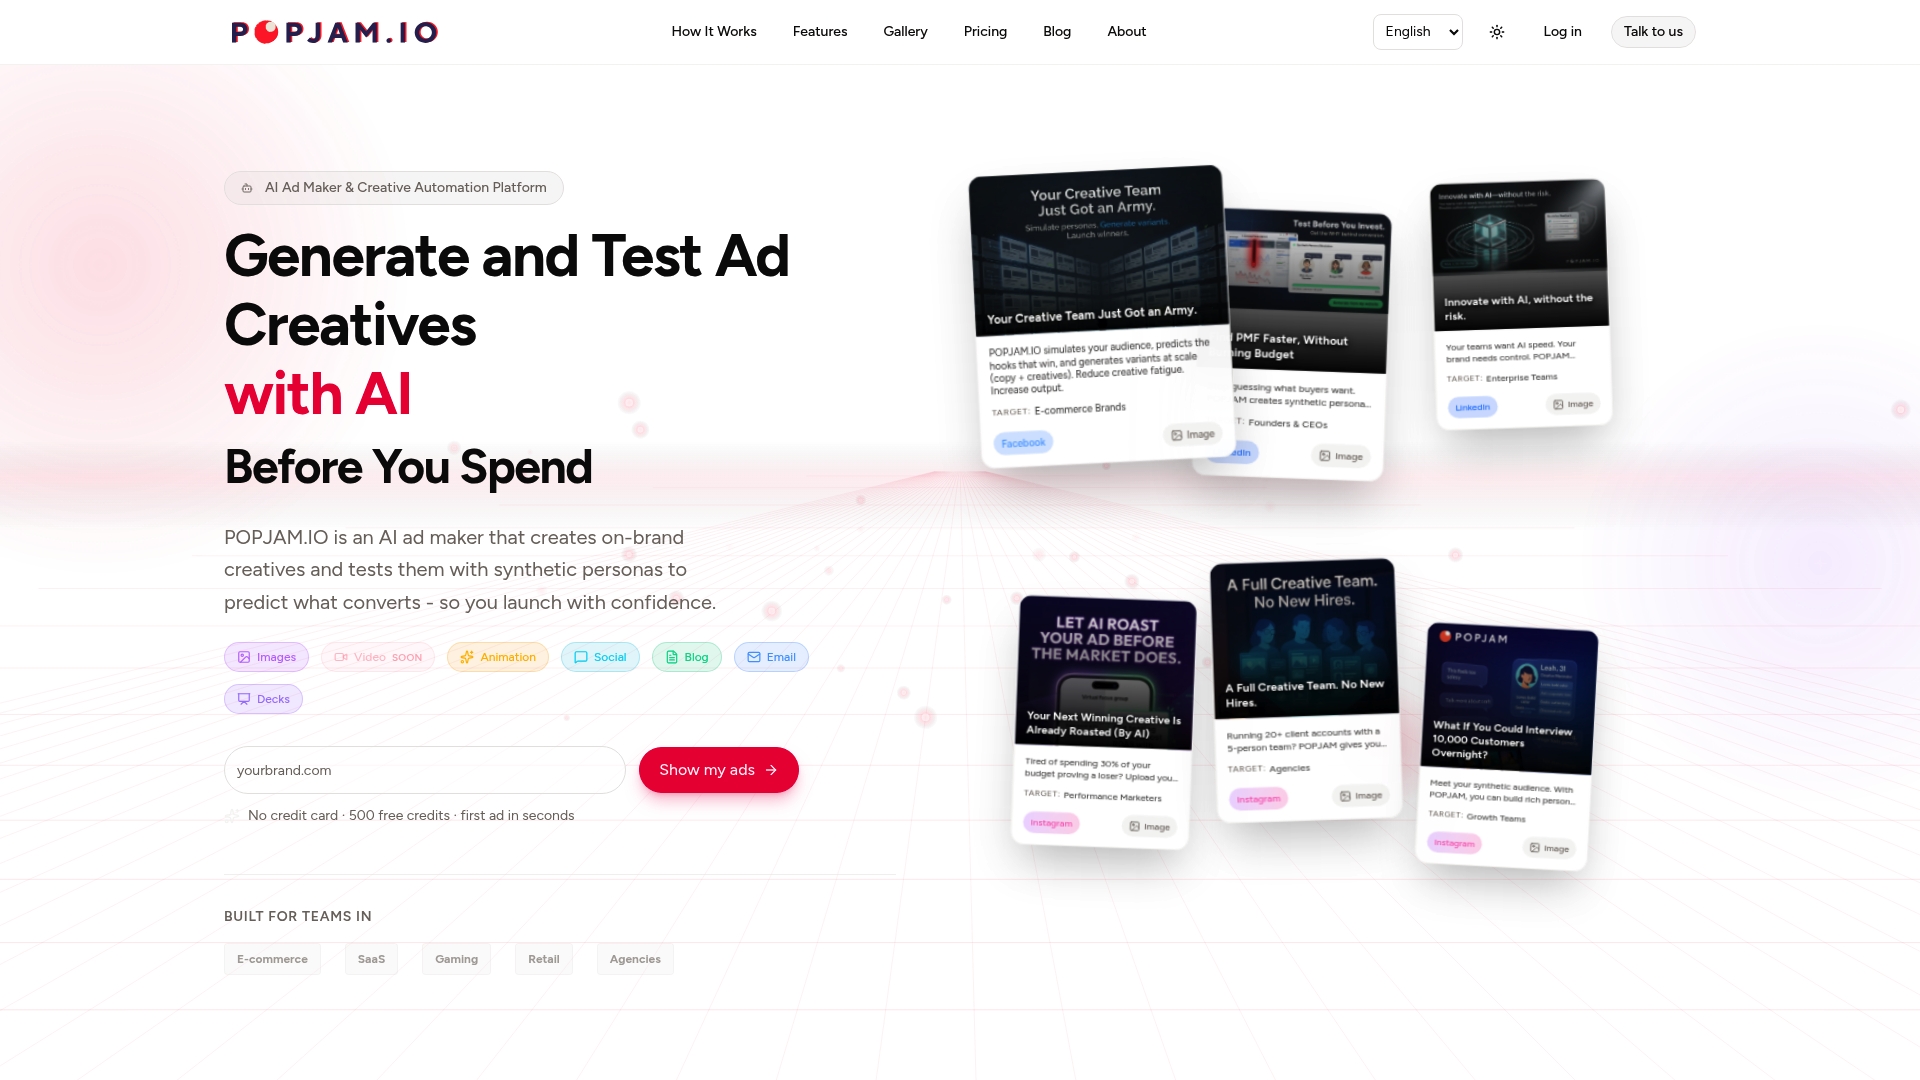
That matters most for the exact problems this article walks through: a weak opening frame, a copy pattern that sounds good internally but flops with the actual audience, an AI-generated hook that spikes attention but might not convert. Instead of burning your testing budget to find that out live, POPJAM’s ad testing tool surfaces it beforehand, across Meta, Google, TikTok, LinkedIn, and Reddit formats.
Plans start with a Free tier, and paid options run from Starter at 29 € per month through Essential at 99 € per month and Business at 399 € per month, with full details on the pricing page. If you’re currently validating creative live and want to see what pretesting catches before spend, check out the AI ad generator and run your next concept through it before it hits a real budget.
Sources
For readers who want to go deeper, Google’s own creative performance guidance explains how automated systems use diverse asset inputs, while Improvado’s advertising analytics guide breaks down channel benchmark tables and optimization timing in more detail than any single article can cover.
- Understanding ad metrics: A guide for digital marketers
- Top Advertising Metrics to Track for Better Campaign Performance | Mailchimp
- About columns in your statistics table - Google Ads Help
- Advertising Analytics Guide: 15 Metrics & Attribution (2026)
- Ad performance metrics every business should track in 2026
FAQ
What Are Good Facebook Ad Benchmarks Right Now?
For conversion-focused paid social campaigns, a CTR between 1% and 2% and a conversion rate between 2% and 5% are typical healthy ranges. CPA varies too much by vertical to state a single number, so compare it against your own historical average rather than a blended industry figure.
What’s a Good CTR for Display Ads?
Display CTR typically runs under 0.5%, and sometimes as low as 0.1%, because display placements are built for reach and retargeting rather than immediate intent. A display CTR near 1% is usually a strong result, not a mediocre one, which is the opposite of how CTR reads on search or social.
What Are Some Creative Ad Ideas That Consistently Perform?
Ads that open on motion or a face in the first two seconds, use specific outcome-driven copy instead of generic claims, and match format conventions (muted-friendly captions on video, single focal point on static) tend to outperform more polished, generic alternatives. Testing a genuinely diverse set of hooks, as Google’s own guidance recommends, matters more than perfecting one single concept.
How Do You Know If Your Ad Creative Is Actually the Problem?
Check CTR against your channel and objective’s benchmark band first; if it’s below the typical range while targeting and bids stay unchanged, the creative is the likely cause. Tools like POPJAM’s synthetic persona testing can help confirm this before you spend budget finding out live.
How Much Does POPJAM Cost?
POPJAM offers a Free plan alongside paid tiers: Starter at 29 € per month, Essential at 99 € per month, and Business at 399 € per month, with Enterprise pricing available on request. Full details and credit pack options sit on the POPJAM pricing page.