

Predict 33% More Sales for Marketers With Quantitative Ad Testing
Practical workflow for marketers: run quantitative ad tests with validated STSL scores, set the right sample size, and use platform experiments to pick...

Quantitative ad testing uses controlled experiments and large-sample measurement to figure out which creative wins before you spend real budget on it. Done right, it’s genuinely predictive: Kantar’s Link validation work found ads scoring high on Short-term Sales Likelihood typically generate more sales than average, while low scorers generate fewer. It’s the right first move whenever you have two or more real creative candidates and enough budget to run a proper split.
TL;DR:
- Quantitative ad testing works best when comparing multiple creative variants early in the campaign cycle, especially before launching or scaling media spend.
- The most predictive methods are platform-native experiments and sample size calculations based on conversions, not clicks, to ensure reliable results.
- Metrics like validated sales likelihood scores carry more weight than vanity metrics, with a focused confidence interval confirming true performance differences.
- Proper test design involves setting clear hypotheses, minimum detectable effects, and fixed sample sizes before launching to avoid misleading conclusions.
- Combining quantitative results with qualitative follow-up helps explain surprising outcomes and guides future creative development efforts.
Table of Contents
- What Quantitative Ad Testing Is Actually For
- Which Quantitative Method Should You Use?
- What Metrics Actually Tell You Whether an Ad Works
- How to Design a Test That Actually Holds Up
- Reading Results Without Fooling Yourself
- Why Most Ad Tests Fail (and How to Fix It)
- When to Add Qualitative Research to Your Quant Results
- A Practitioner’s Checklist Worth Pinning
- How POPJAM Fits Into Your Testing Workflow
- Sources
- FAQ
What Quantitative Ad Testing Is Actually For
Here’s the thing nobody tells you when you’re staring at three ad variants and a launch deadline: quantitative testing isn’t one tool, it’s a category. It covers pre-launch creative validation (does hook A beat hook B?), format and placement comparisons (Reels versus feed, static versus video), and even bidding or landing page tradeoffs once traffic is live.
What it’s good at: giving you a number, not a feeling. What it’s bad at: telling you why one ad won, which is where a lot of teams get stuck after the data comes in.
The strongest case for quantitative methods is the predictive evidence behind them. Kantar’s research on validated Link scores found that top-third ads on STSL more often saw a post-launch sales increase than bottom-third ads. That’s not a marginal edge. It’s the difference between a coin flip and a real bet.
Where quant testing fits in the campaign lifecycle:
- Pre-launch: comparing creative concepts before any media dollars go out
- Mid-flight: format or placement experiments once a concept is proven
- Post-launch: bid strategy and landing page comparisons to squeeze more from a winner
Which Quantitative Method Should You Use?
Not every test question calls for the same setup. Picking the wrong method wastes budget and, worse, gives you a false sense of certainty. Here’s how the core approaches stack up:
- A/B and split testing. Two variants, one variable, split traffic. This is your default for straightforward “does X beat Y” questions on live platforms.
- Monadic testing. Each respondent sees only one ad, in a survey panel setting, and rates it in isolation. Use this when you want a clean read on an ad’s standalone impact without comparison bias.
- Sequential monadic testing. Respondents see multiple ads back to back, each still evaluated as if it were the only one shown. It’s more efficient per respondent than pure monadic, but order effects are a real risk you have to control for.
- Platform-native experiments. Google Ads Experiments and Meta Experiments split traffic into mutually exclusive buckets, which matters because manual A/B tests on the same platform let variants bid against each other in the same auction, inflating CPCs and corrupting your results.
- Sequential testing (SPRT-style). Lets you peek at results early without breaking statistical validity, but it requires a larger total sample and a pre-specified stopping rule, trading flexibility for sample size.
Survey-based panel tests earn their keep before you’ve built full campaigns, when you’re comparing concepts, not live performance. Once creative is built and budget is flowing, platform experiments give you the real-world signal panels can’t.
What Metrics Actually Tell You Whether an Ad Works
Not all metrics carry the same weight, and treating a vanity number like a decision-making number is how good creative gets killed early. Leading indicators (impressions, CTR, thumb-stop rate, attention scores) tell you if people are even noticing the ad. Outcome metrics (CVR, CPA, ROAS, and validated sales-likelihood scores) tell you if that attention actually converts.
The gap between the two matters more than either alone. An ad with a great thumb-stop rate and a mediocre CVR usually has a hook problem disguised as a targeting problem.
| Metric type | What it measures | When it matters most |
|---|---|---|
| CTR | Initial interest and hook strength | Early funnel, format testing |
| Thumb-stop rate | Attention in scroll-heavy feeds | Video and social creative |
| CVR | Conversion once clicked | Landing page and offer testing |
| CPA / ROAS | Cost efficiency of conversions | Scaling and budget decisions |
| STSL-style score | Validated likelihood of near-term sales lift | Pre-launch creative selection |
That last row is the one with real teeth. A high-STSL ad correlates with a 33% sales lift over average, according to Kantar’s Link data, which is why more teams are pulling validated sales-likelihood scoring into their pre-launch checklist instead of relying on CTR alone. If you want a deeper breakdown of how creative-level metrics connect to performance, POPJAM’s guide on creative performance analysis walks through the mechanics.
How to Design a Test That Actually Holds Up
Most bad test results aren’t bad luck, they’re bad design. Before you launch anything, lock down these four things:
- Set your minimum detectable effect (MDE). Decide the smallest lift worth acting on. A 2% CVR bump might matter for a $50 million account and be noise for a $5,000 one.
- Target 80% statistical power and 95% confidence. These aren’t arbitrary. They’re the industry-standard thresholds that keep you from calling a winner that’s actually a fluke.
- Calculate sample size around conversions, not clicks. Small conversion volumes make detecting a small MDE nearly impossible without a much bigger budget. For CPA-focused tests, aim for 100+ conversions per variant as a practical floor.
- Set your duration and split before launch, not after. A 50/50 split gets you to a reliable answer fastest, but campaign-type experiments (like Performance Max versus Shopping) often need 6 to 12 weeks to clear platform learning phases and seasonal noise.
Pro Tip: Write your hypothesis and your stopping date on a shared doc before the test goes live. The single biggest source of bad calls isn’t math, it’s teams changing their mind about what “success” means halfway through.
Reading Results Without Fooling Yourself
A confidence interval tells you the range your true result likely falls in, not just whether you “won.” If your 95% confidence interval for a CVR lift spans from -1% to +8%, you don’t have a winner yet, you have noise with a hopeful shape.
Statistical significance and practical significance are not the same thing. A test can hit 95% confidence on a 0.3% CVR improvement that will never move your P&L. Before declaring a winner, check:
- Does the confidence interval exclude zero, and by a meaningful margin?
- Is the effect size big enough to matter at your actual budget?
- Did the test run through a full platform learning phase, so early instability isn’t skewing the read?
- Are you comparing results using the same attribution window across variants?
Once you have a real winner, scale it gradually rather than reallocating all budget overnight. Sudden spend shifts can reset a campaign’s learning phase and quietly erase the very edge you just proved.
Why Most Ad Tests Fail (and How to Fix It)
Three mistakes account for most invalid results. Auction overlap tops the list: running two ads as separate campaigns on the same platform lets them bid against each other, inflating CPCs and muddying attribution. The fix is a platform experiment or hard audience exclusions, not a manual split.
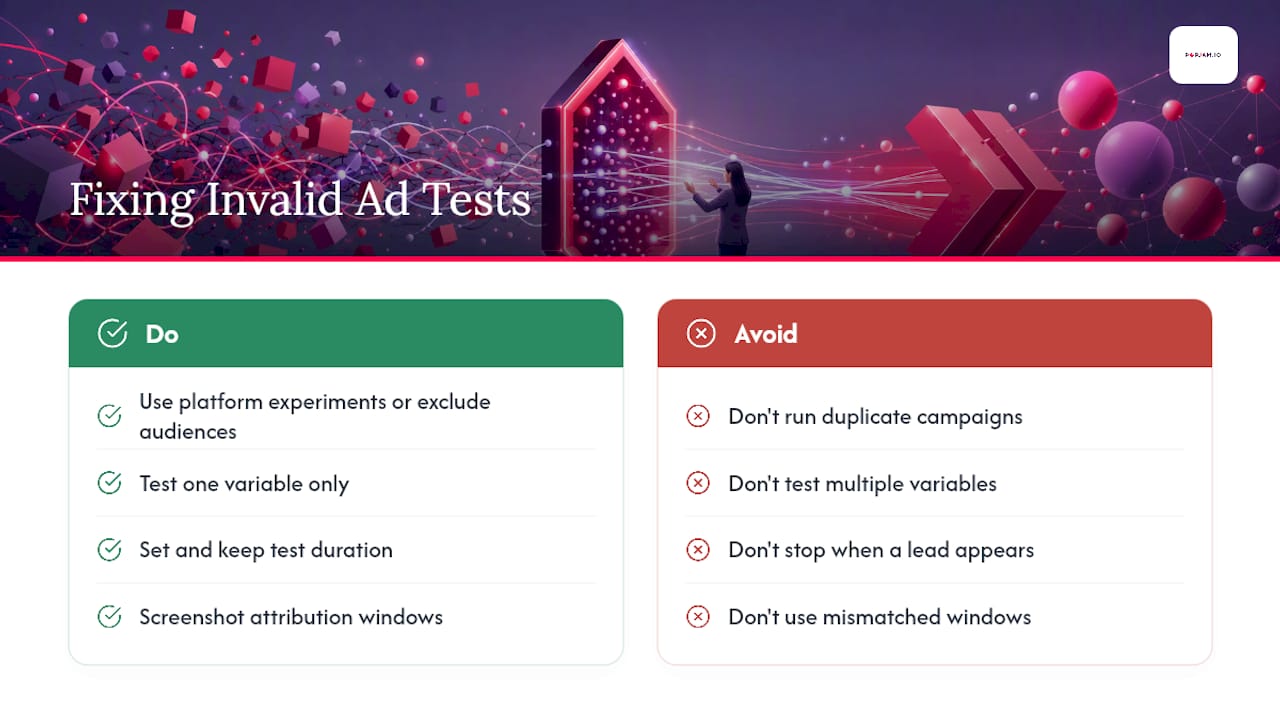
Second, testing too many variables at once, or stopping the moment a lead appears, both invalidate your read. Commit to one variable and one duration before you launch.
Third, attribution windows quietly wreck comparisons. If Variant A gets credit on a 7-day click window and Variant B on a 1-day view window, you’re not comparing performance, you’re comparing settings.
Pro Tip: Screenshot your attribution window settings for every variant before launch. It takes ten seconds and prevents the single most common “why did this test lie to us” post-mortem.
When to Add Qualitative Research to Your Quant Results
A quant test tells you which ad won. It rarely tells you why, and that gap is where a lot of teams stall out after a “successful” test with no clear next move.
Run qualitative follow-up when a result surprises you, or when you need direction for the next creative round, not just a scoreboard. Useful patterns include:
- Theatre-style testing paired with a follow-up survey to probe reactions to the winning concept
- Quali-quant designs where you interview a subset of quantitative respondents who scored the ad highest or lowest
- Diagnostic questions like “What almost stopped you from watching this?” rather than generic satisfaction ratings
Findings from that follow-up become your next quant hypothesis, which is exactly the loop Ipsos describes in its work on pairing pre-testing methods.
A Practitioner’s Checklist Worth Pinning
If you take one thing from this: pick one hypothesis, calculate your sample size before launch, use platform experiments to dodge auction overlap, and don’t call a winner until your confidence interval clears zero with a margin that matters. Everything else is detail.
— Doruk
How POPJAM Fits Into Your Testing Workflow
If your bottleneck is producing enough real creative variants to test in the first place, that’s the gap POPJAM was built to close. Instead of waiting weeks for a design team to turn around three hook variations, POPJAM generates on-brand ad creative and runs it against synthetic buyer personas before a single dollar hits the auction.
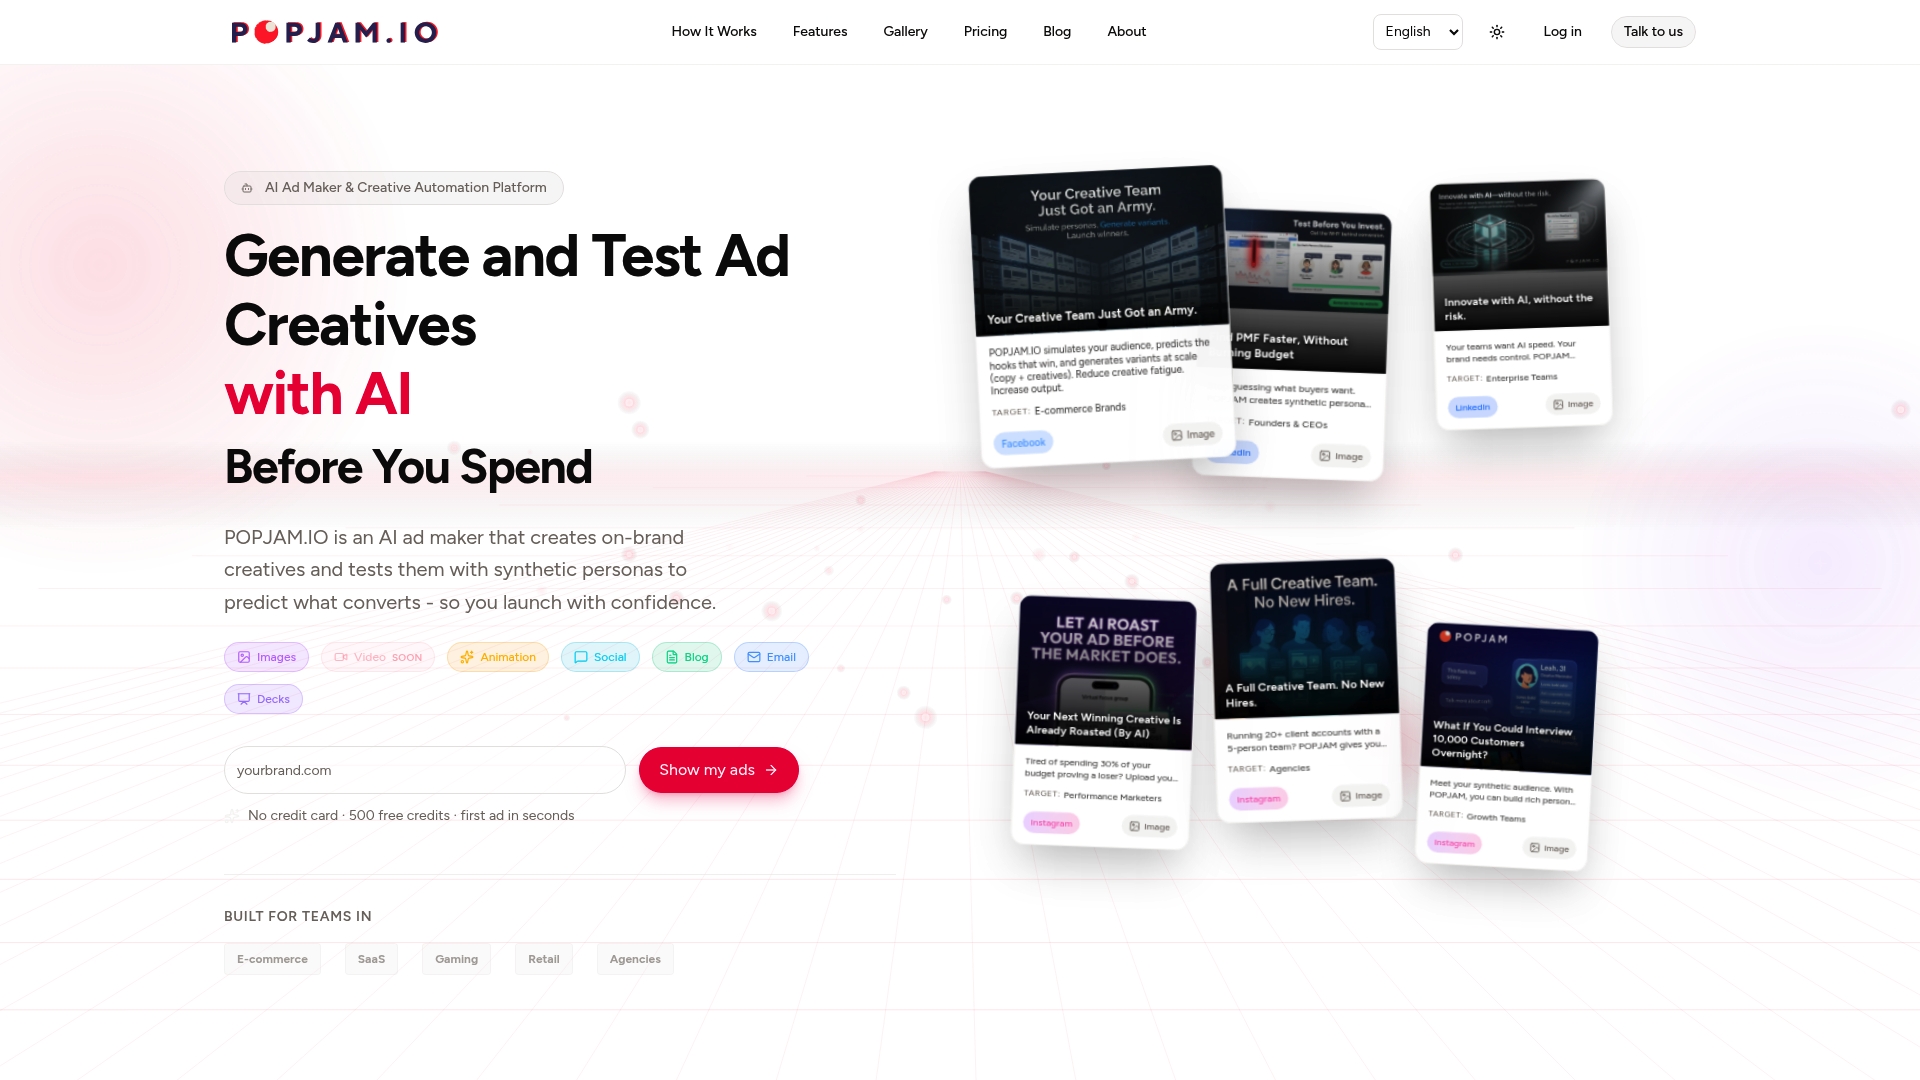
That means you get a directional read on which concepts are worth putting into a real platform experiment, before you spend the budget to find out live. It’s not a replacement for the statistical rigor covered above, it’s the step that feeds it: faster variant production, earlier signal, fewer wasted test slots on ideas that were never going to win. If you’re building your next round of creative for Meta, Google, or TikTok, try the AI ad generator and run your first synthetic persona test before your next launch date.
Sources
- Can ad testing really predict sales impact? (Kantar Link sales validation)
- A/B Testing for Paid Ads: Step-by-Step with Google Ads and Meta (2026)
- Google Ads Experiments: How To A/B Test | 2026
- A/B testing Facebook ads: statistical guide (Wevion)
FAQ
What does ad testing mean?
Ad testing means systematically comparing ad variants, using either controlled experiments or panel-based surveys, to measure which one performs better on a defined metric before or during a live campaign.
What are the main types of quantitative ad testing methods?
The core methods are A/B and split testing, monadic testing, sequential monadic testing, platform-native experiments, and sequential statistical testing (SPRT-style), each suited to different stages of the campaign lifecycle.
What’s the difference between qualitative and quantitative ad testing?
Quantitative testing measures numeric outcomes like CTR, CVR, and validated sales likelihood across large samples, while qualitative testing gathers open-ended reactions from smaller groups to explain why an ad performs the way it does.
How much does it cost to test ads?
Cost depends mainly on the sample size your minimum detectable effect requires. Reaching the 100+ conversions per variant floor recommended for CPA-focused tests can mean a meaningful media spend before results are reliable, which is why validating creative concepts with tools like POPJAM before launch helps cut wasted test budget.