

Hook Rate for Performance Marketers: Measure, Benchmark, Improve
Hook rate is the percentage of ad impressions where a viewer watches the first 2–3 seconds of your video. The formula is simple: divide your 2-second or 3-second video views by total impressions, then multiply by 100. On Meta, the standard threshold is 3 seconds; on TikTok, most practitioners use 2 seconds because the feed moves faster and attention drops off sooner. If your hook rate is low, the first fix is almost always the opening frame, not the audience or the budget.
This metric matters because it’s the earliest creative-quality signal you’ll get, often within hours of launch. A weak hook rate tells you the algorithm is serving your ad but viewers are scrolling past it immediately. That translates directly into wasted impressions, rising CPMs, and a downstream conversion rate that never gets a fair shot. A strong hook rate, on the other hand, signals to the platform that your creative earns attention, which tends to improve delivery efficiency and lower your cost per result.
- Hook rate formula (Meta): (3-second video views ÷ impressions) × 100
- Hook rate formula (TikTok): (2-second video views ÷ impressions) × 100
- First check if your rate is low: swap the opening frame, test a new first-second visual or text overlay, and re-run before touching targeting or budget.
Key Takeaways
Hook rate is the single fastest creative-quality signal available on Meta and TikTok, and acting on it before scaling spend is the most direct way to reduce wasted impressions and improve campaign efficiency.
| Point | Details |
|---|---|
| Use platform-specific formulas | Meta uses 3-second views ÷ impressions; TikTok uses 2-second views ÷ impressions. Never mix thresholds. |
| Apply the right benchmarks | On Meta, above 25% is healthy and above 35% is strong; on TikTok, above 15% is the healthy floor. |
| Require minimum sample sizes | Read hook rate only after 5,000+ impressions per variant; treat sub-5,000 reads as directional only. |
| Pair hook rate with hold rate and CTR | Hook rate alone doesn’t tell you if the creative converts; always read it alongside hold rate and CTR. |
| Validate before launch with POPJAM | POPJAM’s pre-launch scorecard and synthetic audience testing surface weak hooks before they waste live spend. |
Table of Contents
- What hook rate actually measures, and how it differs from related metrics
- How to calculate hook rate: formula and a worked example
- Where to find and track hook rate in Meta and TikTok
- What a good hook rate looks like, and why benchmarks need caveats
- Why hook rate affects your campaign economics
- How to improve hook rate: tactics and a testing workflow
- Real ad hooks that stop the scroll, and why they work
- Common measurement pitfalls that distort hook rate data
- How to use hook rate in reporting and when to act
- Pre-launch creative validation: the POPJAM scorecard approach
- What’s actually working in hooks right now
- Validate your hooks before you spend a dollar
- Sources
- FAQ
What hook rate actually measures, and how it differs from related metrics
Hook rate captures one specific moment: did your ad stop the scroll long enough for a viewer to reach the 2- or 3-second mark? It says nothing about what happened after that. That distinction is what separates it from every other view metric in your dashboard.
The two most common measurement thresholds reflect platform behavior. TikTok uses a 2-second view as its native benchmark because the swipe gesture is faster and users make snap decisions in under a second. Meta’s standard is 3-second video plays, which aligns with how the platform counts a “video view” in its reporting. Neither threshold is universal, and that’s the first caveat to internalize before comparing numbers across platforms.
Related metrics and when each one earns its place:
- Hold rate (retention rate): the percentage of viewers who watch beyond the hook window, often measured at 25%, 50%, or 75% of the video. Where hook rate tells you whether the opening worked, hold rate tells you whether the middle kept people watching.
- View rate (VTR): total video views divided by impressions, usually measured at a longer threshold (ThruPlay on Meta, or 6-second views). Useful for overall creative quality but too slow to act as an early signal.
- Click-through rate (CTR): clicks divided by impressions. CTR measures intent to act, not attention capture. A high hook rate with a low CTR usually points to a messaging or offer problem, not a creative problem.
- View-through rate: often used interchangeably with VTR but sometimes refers specifically to completed views. Context-dependent; check your platform’s definition before using it in reports.
| Metric | Numerator | Denominator | Primary use case |
|---|---|---|---|
| Hook rate | 2s or 3s video views | Impressions | Early creative-quality signal |
| Hold rate | Views past hook window | Total video views | Mid-video retention check |
| View rate (VTR) | Total video views (longer threshold) | Impressions | Overall creative engagement |
| CTR | Clicks | Impressions | Intent and offer relevance |
| Conversion rate | Conversions | Total audience reached | Downstream funnel efficiency |
The practical takeaway: use hook rate to triage creative fast. Use hold rate and CTR together to diagnose what went wrong or right after the hook. Never act on hook rate alone.
How to calculate hook rate: formula and a worked example
The math is straightforward. What trips people up is pulling the right numbers from the right columns in their dashboard.
Formulas by platform:
- Meta Ads Manager: Hook Rate = (3-Second Video Plays ÷ Impressions) × 100
- TikTok Ads Manager: Hook Rate = (2-Second Video Views ÷ Impressions) × 100
Step-by-step calculation:
- Open your platform dashboard and filter to the specific ad (not the ad set or campaign level, where aggregation hides creative-level signals).
- Pull the “3-second video plays” column (Meta) or “2-second video views” column (TikTok).
- Pull the “impressions” column for the same ad and date range.
- Divide video views by impressions.
- Multiply by 100 to express as a percentage.
Worked example:
Say your Meta ad received 18,400 impressions and 5,520 three-second video plays over a 7-day window.
Now compare it to a second creative that pulled 9,200 impressions and 1,380 three-second plays:
The second creative is underperforming. Before you pause it, check the impression count. At 9,200 impressions, you have enough data to make a directional call, but not enough to be certain. Most practitioners set a minimum of 5,000–10,000 impressions before treating a hook rate as reliable. Below that threshold, a single day of unusual delivery can skew the number by 5–10 percentage points.
Pro Tip: When comparing two creatives, always normalize the date range and placement. A Reels placement and a Feed placement on the same account will produce different hook rates for the identical video, so comparing them without segmentation is a common source of false conclusions.
Where to find and track hook rate in Meta and TikTok
Neither platform labels a column “hook rate” by default. You build it yourself, either through custom metrics or by exporting raw columns and calculating in a spreadsheet.
Meta Ads Manager
- Open Ads Manager and navigate to the Ads level (not campaigns or ad sets).
- Click Columns in the top right, then select Customize Columns.
- Search for “Video plays at 3 seconds” and add it to your active columns alongside “Impressions.”
- To create a calculated custom metric: click Create Custom Metric, name it “Hook Rate (3s),” and enter the formula:
Video Plays at 3 Seconds / Impressions * 100. - Save the column set as a preset (e.g., “Creative Performance View”) so you can load it in one click each session.
TikTok Ads Manager
- Navigate to Ad level reporting inside TikTok Ads Manager.
- Click Customize Columns and search for “2-second video views” and “Impressions.”
- Export to CSV if you want to calculate hook rate in a spreadsheet, since TikTok’s custom metric builder is more limited than Meta’s.
- For ongoing tracking, use the Custom Report builder under the Reporting tab to schedule a daily email export with both columns included.
Practical tracking tips
- Naming convention: label your custom metric consistently across accounts (“Hook Rate 3s Meta,” “Hook Rate 2s TikTok”) so cross-account reporting doesn’t mix thresholds.
- API vs. UI: for accounts running more than 20 active creatives, pull data via the Meta Marketing API or TikTok Marketing API rather than the UI. The UI samples data at high volumes; the API returns exact counts.
- Batch checks: set a calendar reminder to review hook rate at 48 hours post-launch and again at 7 days. The 48-hour check catches obvious failures early; the 7-day check gives you enough impressions for a reliable read.
- Alert setup: in Meta, use Automated Rules to flag any ad where 3-second video plays drop below a threshold percentage of impressions. Set the rule to notify you by email rather than auto-pause, so you review before acting.
Pro Tip: If you’re running the same creative across Reels, Feed, and Stories placements, always break out hook rate by placement before drawing conclusions. Reels placements typically show lower hook rates than Feed because the audience is in a faster-scroll mode, and penalizing a creative for a Reels-specific behavior is a common misread.
What a good hook rate looks like, and why benchmarks need caveats
Benchmark bands from practitioner research give you a starting point, but treat them as orientation, not hard rules.
| Platform | Threshold | Below average | Average | Good | Strong |
|---|---|---|---|---|---|
| Meta (Feed/Reels) | 3-second views | Under 20% | 20–25% | 25–35% | Above 35% |
| TikTok | 2-second views | Under 15% | 15–25% | 25–40% | Above 40% |
| General (cross-platform guideline) | 2s or 3s | Under 20% | 20–40% | 40–60% | Above 60% |
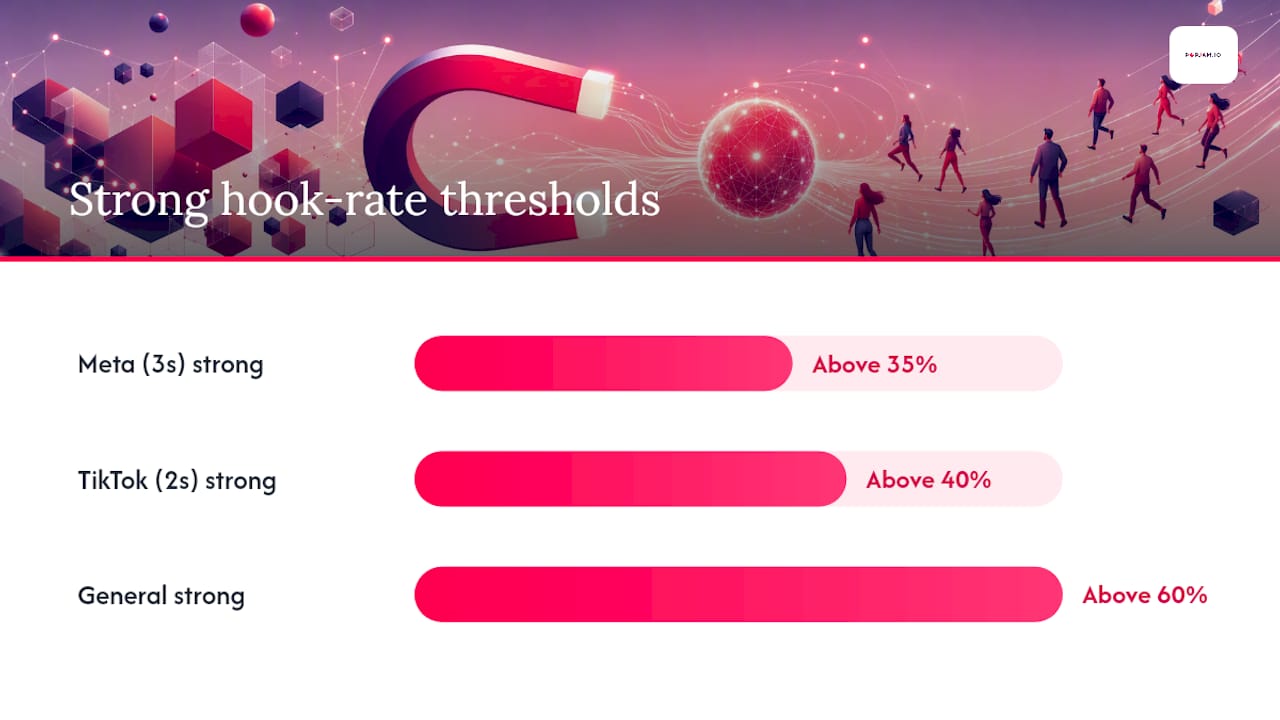
The Meta-specific bands (healthy above 25%, strong above 35%) come from platform-level practitioner data. TikTok’s lower healthy threshold reflects a faster-swipe environment where even well-crafted hooks face a steeper attention curve.
Why these numbers shift:
- Placement: Reels and Stories placements consistently produce lower hook rates than in-feed placements for the same creative. A 20% hook rate on Reels may be equivalent to a 30% rate on Feed in terms of relative performance.
- Creative length: a 6-second ad has a structurally higher hook rate than a 30-second ad because there’s less time to lose the viewer. Comparing them directly is misleading.
- Audience temperature: retargeting audiences who already know your brand tend to hook at higher rates than cold prospecting audiences. Segment before benchmarking.
- Autoplay behavior: both Meta and TikTok autoplay video with sound off by default in most placements. A hook that relies on audio to grab attention will underperform against one that leads with a visual or text overlay.
A note on sample size: a hook rate calculated on fewer than 5,000 impressions can swing by 10+ percentage points from one day to the next due to delivery variance. Never make a pause or scale decision on a sub-5,000 impression read.
Academic research on attention metrics and short-form video confirms that early attention signals are measurable but that measurement methods vary significantly, which is exactly why cross-platform comparisons without normalization produce unreliable conclusions.
Why hook rate affects your campaign economics
A low hook rate isn’t just a creative problem. It’s a budget problem. Here’s the causal chain.
When viewers scroll past your ad in the first 2–3 seconds, the platform registers a low engagement signal. Over time, that signal tells the algorithm your creative isn’t earning attention relative to competing ads in the auction. The result is that your effective CPM rises because the platform deprioritizes your delivery or requires a higher bid to maintain reach. Higher CPM means you’re paying more per thousand impressions for the same or worse results.
Now flip it. The platform rewards that with more efficient delivery, which tends to lower CPM and improve the cost per click and cost per acquisition downstream. The conversion rate at the bottom of the funnel, which for ecommerce typically sits around 2.5–3%, only gets a fair shot when the top of the funnel is working efficiently.
Where hook rate fits in the decision hierarchy:
- If hook rate is low and CTR is also low, the creative is the primary bottleneck. Fix the opening frame first.
- If hook rate is healthy but CTR is low, the problem is likely the offer or the call to action, not the attention capture.
- If hook rate and CTR are both healthy but conversion rate is low, the landing page or post-click experience is the constraint. Improving the hook further won’t move revenue.
- If hook rate is high but hold rate drops sharply after 5 seconds, the middle of the video is losing people. The hook worked; the story didn’t.
Improving initial attention capture is often faster and cheaper than fixing post-click conversion when the creative is the bottleneck. Measure both upstream and downstream jointly to identify which lever to pull.
How to improve hook rate: tactics and a testing workflow
The opening frame is doing more work than most marketers give it credit for. Here’s what actually moves the number.
Creative tactics that lift early retention
- Lead with motion or a visual pattern interrupt. A static opening frame in a feed full of motion is invisible. Start with movement, a zoom, a cut, or an unexpected visual in the first half-second.
- Put text on screen immediately. Most video plays without sound. A bold text overlay in the first second gives silent viewers a reason to stay. Keep it to 5–7 words maximum.
- Show a face in the first frame, and make it expressive. Faces with strong emotional expressions (surprise, curiosity, delight) consistently outperform product-only openers in direct-response creative.
- Use an offer-first or curiosity-first structure, not a brand-first one. Opening with a logo or brand name is the fastest way to lose a cold audience. Open with the problem, the result, or a provocative question instead.
- Cut the slow build. If your video has a 3-second intro before anything interesting happens, the hook rate will reflect that. Start in the middle of the action.
- Match the platform’s native aesthetic. A polished, high-production opener on TikTok often underperforms a raw, lo-fi clip because it reads as an ad immediately. On Meta Feed, slightly higher production quality is more acceptable.
- Test audio-first hooks selectively. A distinctive sound or voice line in the first second can work in placements where sound is on by default, but always pair it with a visual hook for sound-off environments.
A repeatable testing workflow
Step 1: Write a hypothesis. “Changing the opening frame from a product shot to a face with text overlay will increase hook rate by at least 5 percentage points.”

Step 2: Build two variants. Keep everything identical except the first 2–3 seconds. Changing more than one variable at a time makes it impossible to attribute the result.
Step 3: Set a minimum sample size. Aim for at least 5,000 impressions per variant before reading results. For higher-spend accounts, 10,000 impressions per variant gives a more reliable signal.
Step 4: Run the test for 7 days minimum. Shorter windows are vulnerable to day-of-week delivery variance.
Step 5: Read hook rate alongside hold rate and CTR. A variant that wins on hook rate but loses on CTR may be grabbing attention with a misleading opener. You want both metrics moving in the right direction.
Step 6: Iterate, don’t pivot. If the winning variant beats the control by 5+ percentage points, make it the new control and test the next variable. If the difference is under 3 percentage points and sample sizes are sufficient, the variable you tested probably doesn’t matter much for this audience.
Pro Tip: Before spending on a live A/B test, run your hook variants through a synthetic audience check. Tools like POPJAM’s pre-launch creative testing simulate audience reactions and surface which opening frame is most likely to hold attention before you commit budget. It’s a fast way to eliminate obvious losers before they waste impressions.
Real ad hooks that stop the scroll, and why they work
These aren’t hypothetical. They’re patterns that show up repeatedly in high-performing direct-response creative across Meta and TikTok.
-
The mid-action opener. The video starts with someone already doing something surprising, like pouring a product into a glass, catching something mid-air, or reacting to an unexpected result. There’s no setup. The viewer is dropped into the middle of a story and has to watch to understand what’s happening. What to test first: try cutting your existing video 2–3 seconds earlier than you think makes sense. The “too abrupt” feeling you get in the edit suite is often exactly what stops the scroll.
-
The bold text claim. A single provocative statement fills the screen in the first frame: “We stopped running Facebook ads for 30 days. Here’s what happened.” No visual complexity, no music, just a claim that creates a knowledge gap. This pattern works especially well on Meta Feed where text-heavy content is native. What to test first: swap the claim for a question format and compare hook rates. Questions often outperform statements for cold audiences.
-
The before/after split. The first frame shows a clear “before” state, usually something messy, broken, or frustrating. The viewer’s brain immediately wants to see the “after.” This works because it creates a visual promise in under a second. What to test first: test whether leading with the “after” (the result) and then cutting to the “before” changes hook rate. For some audiences, showing the aspirational outcome first performs better.
-
The unexpected product use. Someone uses a familiar product in an unfamiliar way. The cognitive dissonance is enough to pause the scroll. This is particularly effective on TikTok where novelty is the dominant currency. What to test first: the audio. A surprised reaction sound or a “wait, what?” voiceover in the first second amplifies the visual surprise.
-
The direct address with urgency. “If you’re running Meta ads and your CPM is above $20, watch this.” Specific, targeted, and immediately relevant to a narrow audience. The hook rate on this type of opener is often lower in raw percentage terms because it self-selects, but the downstream CTR and conversion rate tend to be significantly higher. What to test first: vary the specificity of the qualifier. “If you run ads” versus “If you run Meta ads” versus “If you run Meta ads and spend over $1,000 a month” will produce different hook rates and different audience quality.
For more annotated examples of what’s working across platforms right now, the social media ad examples resource covers current patterns with platform-specific notes.
Common measurement pitfalls that distort hook rate data
Hook rate looks simple. The pitfalls are not.
-
Autoplay artifacts. Both Meta and TikTok autoplay video in feed. A “view” at the 2- or 3-second mark may reflect autoplay behavior rather than genuine attention. This inflates hook rates, particularly in placements where the video is large on screen and plays automatically as the user scrolls slowly. Validate by checking hold rate: if hook rate is high but hold rate drops sharply at 5 seconds, autoplay is likely inflating the early number.
-
Impression vs. viewability mismatch. An impression is counted when the ad is served, not necessarily when it’s visible on screen. If a significant portion of your impressions are below the fold or in low-viewability placements, your hook rate denominator is inflated and your rate looks lower than it actually is for visible impressions.
-
Bot traffic and fraud. On open exchanges and some programmatic placements, bot traffic can generate impressions without genuine views, suppressing hook rate. On Meta and TikTok’s owned inventory, this is less of a concern, but it’s worth checking if you’re running across networks.
-
Small-sample noise. A hook rate calculated on 1,000 impressions can shift by 15 percentage points in either direction from one day to the next. Never make a creative decision on fewer than 5,000 impressions, and treat 10,000 as the reliable floor for comparative decisions.
-
Cross-platform non-equivalence. A TikTok 2-second hook rate and a Meta 3-second hook rate are not the same measurement. Comparing them directly, as if a 25% rate on TikTok equals a 25% rate on Meta, is a category error. Measurement methods vary and require careful interpretation before drawing cross-platform conclusions.
-
Aggregation at the wrong level. Pulling hook rate at the campaign or ad-set level averages across creatives and placements, which hides the signal. Always read hook rate at the individual ad level, segmented by placement.
Validation checklist when a hook rate result surprises you:
- Check the impression count. Is it above 5,000?
- Check the date range. Does it span at least 5 days?
- Check the placement breakdown. Is one placement skewing the aggregate?
- Cross-reference with hold rate. Does the retention curve match what the hook rate implies?
- Pull the data via API rather than the UI if the account is high-volume. UI sampling can introduce variance.
For a deeper look at how data-driven creative testing reduces these misreads, the methodology applies directly to hook-rate validation workflows.
How to use hook rate in reporting and when to act
Hook rate earns its place in reporting when it’s tied to a decision, not just a number on a slide.
Decision thresholds (Meta Feed, minimum 5,000 impressions):
- Scale candidate: hook rate above 30% AND hold rate above 40% AND CTR trending positive. Increase budget by 20–30% and monitor CPM for 48 hours.
- Iterate candidate: hook rate between 20–30%. The creative is getting some attention but not enough. Test a new opening frame before scaling.
- Pause candidate: hook rate below 20% after 7,500+ impressions. The creative is not stopping the scroll. Pause and replace rather than waiting for the algorithm to optimize its way out.
Segmentation checklist before reporting to stakeholders:
- Break hook rate by placement (Feed, Reels, Stories) before aggregating.
- Separate prospecting and retargeting audiences. Retargeting will almost always show higher hook rates.
- Check device split. Mobile-first creatives often show different hook rates on desktop placements.
- Note the day-of-week pattern. Hook rates on weekends can differ from weekday rates for certain audiences.
- Flag any creative that changed mid-flight (edits, budget shifts, audience changes) as those events reset the learning phase and distort trend data.
Presenting hook rate to stakeholders:
Keep it simple. A single bar chart showing hook rate by creative variant, with a reference line at your platform-specific benchmark, communicates the story faster than a table of raw numbers.
For a full framework on audience research methods that complement hook-rate segmentation, the pairing of creative signals with audience data is where the real efficiency gains show up.
Pre-launch creative validation: the POPJAM scorecard approach
The most expensive place to discover a weak hook is after you’ve spent $500 on impressions. The smarter move is to validate before launch.
POPJAM’s pre-launch creative scorecard runs five checks on every creative before it goes live:
- Hook check: does the opening frame create an immediate visual or textual reason to stop scrolling? Test at least two opening variants before choosing one.
- Messaging clarity check: can a viewer understand the offer or value proposition within the first 5 seconds, even with sound off?
- Brand match check: does the creative align with the brand’s visual identity and tone, or does it feel like a borrowed template?
- Variant diversity check: are the test variants genuinely different in their hook mechanic, or are they minor color and copy tweaks that won’t produce meaningful signal?
- Sample-size validation: is the planned test budget sufficient to reach 5,000–10,000 impressions per variant before a decision is made?
The pre-launch workflow:
- Generate 2–3 hook variants using your creative brief.
- Run each variant through POPJAM’s synthetic audience simulation to collect psychographic feedback on which opening frame resonates most with your target segment.
- Use the scorecard to eliminate variants that fail the hook, clarity, or brand match checks before spending.
- Launch the surviving variants as a live micro-test with a capped budget (enough to reach 5,000 impressions per variant).
- Read hook rate and hold rate at 48 hours. If one variant is already below 15%, pause it and reallocate budget to the stronger performer.
- Scale the winner once it clears 10,000 impressions with a hook rate above your platform benchmark.
The advantage of synthetic testing is speed. You get directional signal on which hook is most likely to perform before the live auction tells you the same thing at full cost. It doesn’t replace live testing, but it eliminates the obvious losers before they waste impressions. For teams running multiple campaigns simultaneously, that pre-launch filter is where the efficiency gains compound fastest.
What’s actually working in hooks right now
The honest answer is that the “best” hook format changes faster than most guides admit. What I’m seeing hold up across accounts right now is the specificity principle: hooks that name a precise problem, audience, or outcome outperform generic attention-grabbers almost every time.
The “pattern interrupt” advice is real but overused. Everyone is doing zoom cuts and unexpected visuals now, which means the bar for what actually interrupts a pattern keeps rising. What’s cutting through in 2026 is specificity combined with a visual that feels native to the platform. On TikTok, that means lo-fi, creator-style framing. On Meta Reels, it means fast cuts with text that front-loads the payoff.
The one concrete recommendation I’d give any performance marketer right now: test a hook that names your audience explicitly in the first 3 words. “If you run ads…” or “E-commerce founders, listen up…” consistently produces lower raw hook rates but significantly higher hold rates and CTR, because the people who stay are the right people. Hook rate is the entry point, not the destination.
Validate your hooks before you spend a dollar
Knowing your hook rate benchmark is one thing. Knowing which creative will hit it before you launch is another. POPJAM’s AI ad generator and pre-launch testing platform lets you generate hook variants, run them through synthetic buyer personas, and collect psychographic feedback on which opening frame is most likely to hold attention for your specific audience segment.
For performance marketers and agencies tired of discovering weak hooks after the budget is gone, POPJAM gives you the signal before the spend. You can test multiple opening frames against simulated audience reactions, apply the five-check pre-launch scorecard, and go live with confidence rather than guesswork. The result is fewer wasted impressions and a faster path to creatives that actually scale. Start your pre-launch validation and see which of your hooks would actually stop the scroll.
Sources
- What Is Hook Rate? Video Ad Metric Explained (2026)
- Hook Rate Formula: How to Calculate It + Benchmarks
- What is Conversion Rate (CVR)? Formula and Calculation | Amazon Ads
- Conversion rate: Definition, Formula & Benchmarks | Shopify
- arXiv preprint on attention metrics and short-form video
FAQ
What is hook rate?
Hook rate is the percentage of ad impressions where a viewer watches the first 2–3 seconds of a video ad. It’s calculated as 2-second or 3-second video views divided by total impressions, multiplied by 100.
How do you calculate hook rate?
Divide your platform’s early video view count (3-second plays on Meta, 2-second views on TikTok) by total impressions, then multiply by 100.
What should my hook rate be?
Always segment by placement before comparing to benchmarks, since Reels and Stories placements typically produce lower rates than Feed.
What is a good hook rate percentage?
Cross-platform comparisons require normalizing for threshold differences.
How does hook rate affect CPM and conversion rate?
A low hook rate signals to the platform algorithm that your creative isn’t earning attention, which tends to raise effective CPM over time. Higher CPM means fewer impressions for the same budget, reducing the volume of clicks and conversions your campaign can generate. Improving hook rate is often the fastest lever when the creative is the primary bottleneck, as noted in conversion rate research.