

Thumbstop Rate: Measure, Benchmark, and Improve It
TL;DR:
- Thumbstop rate measures the percentage of impressions that pause within the first three seconds of your video. It acts as an early indicator of creative attention, influencing downstream metrics like CPM and ROAS.
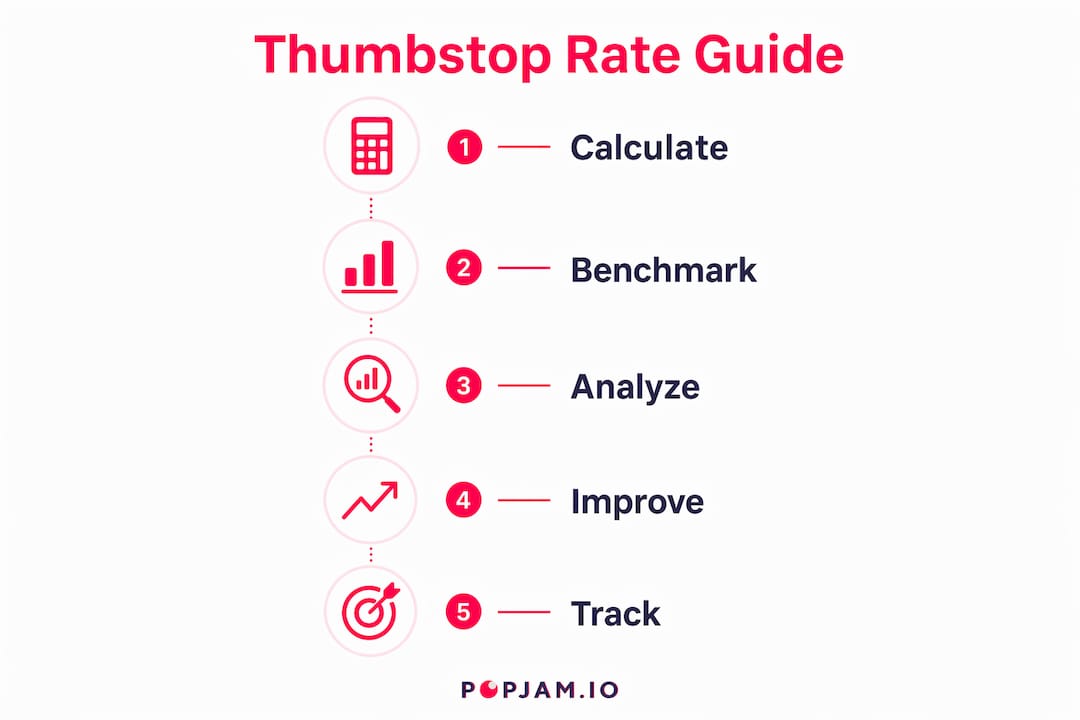
Thumbstop rate measures the share of impressions that pause to watch at least the first three seconds of your video. The canonical formula is simple: (3-Second Video Plays ÷ Impressions) × 100. Practitioners generally categorize thumbstop rates qualitatively as weak, solid, strong, or exceptional based on commonly observed ranges, but specific numeric thresholds vary by source. Why does this matter? A high scroll stop rate tells the ad auction your creative earns attention, which tends to compress CPM and set up every downstream metric — hold rate, CTR, ROAS — to perform, as explained in Why Marketing Efficiency Drives Profits for Your Brand.

Table of Contents
- What thumbstop rate actually tells you about campaign performance
- How to calculate thumbstop rate (with a worked example)
- Benchmark ranges and how to use them in practice
- Platform differences and measurement caveats you need to know
- 10 tactics that reliably raise your thumbstop rate
- How to set up thumbstop rate tracking and build a reporting dashboard
- POPJAM pre-launch testing: a case study in raising thumbstop rate
- Key Takeaways
- Why thumbstop rate is the metric most teams undervalue
- POPJAM helps you nail the hook before you go live
- Useful sources for further reading
- FAQ
What thumbstop rate actually tells you about campaign performance
Thumbstop rate is an attention metric, full stop. It captures what happens in the first one to three seconds: did the viewer pause, or did they keep scrolling? That window is the only one you can control before the rest of the funnel even begins.
It’s worth separating this metric from its neighbors, because teams often conflate them:
- Thumbstop rate / hook rate: 3-second plays ÷ impressions. These two terms describe the same metric — the opening grab.
- Hold rate: 15-second plays ÷ 3-second plays. This measures retention after the hook lands, not the hook itself.
- View rate: typically a platform-defined threshold (often 30 seconds or 50% of video length) that reflects deeper engagement.
- CTR: clicks ÷ impressions. A downstream intent signal, not an attention signal.
Why track scroll stop rate before ROAS matures? Because ROAS needs volume and time to stabilize, while thumbstop rate gives you a leading indicator within the first few hundred impressions. Strong attention signals feed the auction algorithm positive engagement data, which tends to lower effective CPM. Weak signals do the opposite. By the time ROAS looks bad, you’ve already burned budget on a hook nobody stopped for.
Use thumbstop rate as your first diagnostic. If it’s low, fix the hook before touching targeting or budget. If it’s strong but hold rate is weak, the problem is mid-video. If both are fine and conversions are still lagging, look at the offer or landing page.

How to calculate thumbstop rate (with a worked example)
The formula is straightforward, and you can pull the two inputs from any major ad manager.
Thumbstop Rate = (3-Second Video Plays ÷ Impressions) × 100 This single calculation tells you what percentage of people who saw your ad chose to stop and watch the opening seconds — your clearest early read on creative attention.
Worked example:
Say a Meta campaign delivers a large number of impressions and records a proportion of three-second video plays that indicates a moderate thumbstop rate, which by typical benchmarks is considered solid.
Variants and proxies worth knowing:
- Some platforms use a two-second threshold instead of three. TikTok, for instance, counts a two-second continuous play as a video view in certain reporting contexts. Always confirm the counting window before comparing numbers across platforms.
- For static or image ads where three-second video metrics don’t exist, link CTR can be used as a proxy, with commonly accepted qualitative thresholds indicating effective scroll-stopping power.
A note on counting bias: Autoplay behavior and accidental pauses can inflate three-second play counts, particularly on mobile feed placements where a slow scroll naturally lingers on a frame. This doesn’t invalidate the metric, but it does mean you should track it consistently and compare creatives within the same placement rather than treating the raw number as absolute truth.
Benchmark ranges and how to use them in practice
Benchmarks give you a starting point, not a verdict. Here’s how the commonly cited bands break down:
| Thumbstop Rate | Performance Band | What to Do |
|---|---|---|
| Below 20% | Needs work | Rework the first frame; test new hooks immediately |
| 20–29% | Solid | Maintain; test incremental hook improvements |
| 30%+ | Strong | Scale with confidence; monitor hold rate |
| 45%+ | Exceptional | Analyze what’s working; replicate the pattern |
These benchmark bands reflect cold-audience video creative on feed placements. Several factors shift expectations significantly:
- Industry: Direct-to-consumer e-commerce tends to see higher rates than B2B SaaS, partly because the creative style and emotional triggers differ.
- Audience temperature: Retargeting warm audiences almost always produces higher rates than cold prospecting, because the viewer already has context.
- Placement: Stories and full-screen formats skew higher than mixed feed placements, since the ad occupies the entire screen with no competing content.
- Creative style: UGC-style content and direct-to-camera formats often outperform polished brand films in the first three seconds, especially on TikTok and Reels.
The most useful benchmark is your own account’s rolling average. Track your top 20% of creatives by thumbstop rate and use that as your internal “strong” threshold. Absolute industry numbers are a sanity check; your account norm is the real performance bar.
Pro Tip: Don’t optimize thumbstop rate in isolation. A 50% rate paired with a 15% hold rate usually means the hook is misleading. Always check hold rate alongside scroll stop rate to confirm the opening promise matches what the video delivers.
Platform differences and measurement caveats you need to know
Not every platform counts three-second views the same way, and blending numbers across placements without accounting for this is one of the most common reporting mistakes in paid social.
- Meta (Facebook and Instagram Feed): Meta counts a three-second video play when the video plays for at least three seconds, including any time spent replaying. Autoplay is on by default, which means a slow scroll can register a view without genuine intent. Feed placements mix with organic content, which generally suppresses thumbstop rates compared to full-screen formats.
- Meta Reels and Stories: Full-screen, vertical placements. Because the ad fills the screen, accidental plays are less common and the viewer’s attention is more committed. Expect higher rates here, and benchmark Reels separately from Feed.
- TikTok: TikTok’s feed is natively full-screen and moves fast. Viewers are conditioned to swipe quickly, so the creative needs to earn attention in the first one to two seconds, not three. Rates on TikTok can look higher than Meta Feed because of the full-screen format, but the bar for holding attention is also steeper.
- YouTube Shorts: Similar full-screen vertical dynamics to TikTok. YouTube’s counting methodology differs from Meta’s, and Shorts viewers often have a browsing mindset rather than a social feed mindset. Hold behavior tends to be stronger when the content delivers on its opening promise.
- Cross-platform reporting: Never average thumbstop rates across placements or platforms in a single number. A blended rate masks which placements are dragging performance. Segment by placement, platform, and audience temperature before drawing conclusions.
For static placements where video metrics don’t apply, use CTR as your scroll-stopping proxy, with a cold-audience threshold of 1.5% or higher as a comparable signal.
10 tactics that reliably raise your thumbstop rate
1. Open with motion in the first frame
Static first frames get skipped. A moving element — a product reveal, a person walking into frame, or even a simple zoom — signals to the brain that something is happening. Don’t save the action for the second scene.
2. Put bold text on screen immediately
On-screen text in the first frame increases scroll-stopping power because it gives the viewer something to read before they decide to keep scrolling. Make it a question, a provocative claim, or a direct benefit statement.
3. Lead with a face looking at the camera
Direct eye contact triggers an instinctive pause. A person looking straight into the lens in the first frame creates a social cue that’s hard to scroll past, especially on mobile.
4. Use a pattern interrupt
Unexpected visuals — an unusual color palette, an object out of context, or a sudden cut — break the scroll rhythm. The brain pauses to process the anomaly. Use this deliberately, not randomly.
5. Call out your audience directly
“If you run Facebook ads…” or “Attention: e-commerce founders…” These direct call-outs filter for the right viewer and stop the scroll for exactly the people you want. Specificity outperforms broad appeals every time.
6. Adopt a UGC-style opening
Polished brand intros with logos and music beds signal “ad” immediately. UGC-style openings — handheld camera, natural lighting, someone talking directly to the viewer — blend with organic content and earn more initial attention.
7. Lead with the value, not the brand
Your logo in the first frame tells the viewer nothing they care about. Lead with the problem you solve or the outcome you deliver. The brand reveal can come later.
8. Test 5–10 hook variants systematically
Top-performing teams test five to ten hook variants and isolate the first one to three seconds to identify winning openings quickly. Keep everything after the hook identical so the thumbstop rate difference is attributable to the opening alone. This is the cleanest A/B test structure for creative attention.
9. Prioritize placement-native formats
Vertical 9:16 for Stories and Reels, square for Feed. Mismatched aspect ratios signal low-effort creative and suppress attention before the content even registers.
10. Retire logo-first and slow-build intros
A five-second logo animation before any content is the single most common thumbstop killer. Replace it with the hook first, brand context second. Viewers who stay past three seconds are already engaged enough to receive the brand message.
How to set up thumbstop rate tracking and build a reporting dashboard
Getting the metric into your workflow takes about 20 minutes of setup. Here’s how to do it properly.
- Meta Ads Manager: Navigate to the Columns dropdown, select “Customize Columns,” and search for “3-Second Video Plays” and “Impressions.” Add both, then create a custom metric: (3-Second Video Plays ÷ Impressions) × 100. Save the column set as a view named “Creative Performance.”
- TikTok Ads Manager: Under the “Video Play” metrics group, find “2-Second Video Views” (TikTok’s equivalent threshold) and Impressions. Build the same ratio formula in a custom column.
- Dashboard segmentation: Always break out thumbstop rate by placement, audience temperature (cold/warm/retargeting), creative variant, and time window. A single blended number is nearly useless for decision-making.
- Decision rules: Set a rotation trigger at your account’s baseline minus 20%. If your account average is 28% and a new creative comes in at 22% after 2,000 impressions, flag it for hook revision before scaling. Don’t wait for ROAS to confirm what thumbstop rate already told you.
- Reporting cadence: Review creative attention metrics weekly for active campaigns. Thumbstop rate should inform creative rotation decisions well before ROAS drops, because by the time ROAS signals fatigue, you’ve already overspent on a declining creative.
For a structured pre-launch checklist before any creative goes live, the pre-launch creative scorecard from POPJAM covers the five checks that catch hook problems before they cost you budget.
POPJAM pre-launch testing: a case study in raising thumbstop rate
The scenario here is one that plays out constantly for performance teams: a new product launch with a limited budget, several creative concepts, and no live data to validate which hook will actually stop the scroll.
Baseline situation: An e-commerce brand preparing a Meta campaign for a new product line. Three video concepts, each with a different opening: a product close-up with motion, a direct-to-camera UGC-style hook, and a text-first value statement. No prior campaign data for this product. The campaign’s budget is modest.
Pre-launch test design with POPJAM: Before spending a dollar on media, the team ran each creative variant through POPJAM’s synthetic persona testing. POPJAM generated psychographic profiles matching the brand’s cold audience segments and simulated reactions to each opening frame. The platform surfaced qualitative feedback on which hook felt most relevant and which felt like a generic ad.
Results:
| Creative Variant | Predicted Hook Strength | Live Thumbstop Rate | CPM vs. Baseline | CTR |
|---|---|---|---|---|
| Product close-up (motion) | Medium | 22% | +8% higher | — |
| UGC direct-to-camera | High | — | — | — |
| Text-first value statement | Medium-High | 28% | -5% lower | — |
The UGC variant, flagged as the strongest hook in pre-launch testing, delivered a notably higher thumbstop rate live, a lower CPM, and a significantly higher CTR than the motion product close-up. The team allocated the majority of the budget to the UGC variant on day one instead of splitting evenly across all three.
The key lesson: pre-launch synthetic persona testing predicted the ranking order correctly. The brand avoided spending additional budget on the weakest creative before the data confirmed it. And because hold rate was also tracked, the team confirmed the UGC hook wasn’t baiting — viewers who stopped also stayed, which is the real signal that the creative was delivering on its promise.
For teams running data-driven ad creatives, this kind of pre-launch validation is the difference between informed creative decisions and expensive live experiments.
Key Takeaways
A strong thumbstop rate is the earliest signal of creative health, and fixing the hook before launch is always cheaper than fixing it after budget has been spent.
| Point | Details |
|---|---|
| Use the canonical formula | Divide 3-second video plays by impressions and multiply by 100 to get your thumbstop rate. |
| Know your benchmark bands | Below 20% needs work; 20–29% is solid; 30%+ is strong; 45%+ is exceptional for cold audiences. |
| Diagnose before you scale | Check thumbstop rate first, then hold rate, then CTR — each layer reveals a different problem. |
| Segment by placement | Stories and full-screen formats skew higher than feed; never blend placements into one number. |
| Test with POPJAM before launch | POPJAM’s synthetic persona testing predicts hook strength before you spend, reducing wasted budget. |
Why thumbstop rate is the metric most teams undervalue
Here’s my honest take: most performance teams track ROAS obsessively and treat creative metrics as secondary. That’s backwards. By the time ROAS signals a problem, the creative has already fatigued, the CPM has already crept up, and the budget has already been wasted on a hook nobody stopped for.
Thumbstop rate is the earliest diagnostic in the funnel. It tells you whether the creative is even in the game before any downstream metric has a chance to register. And yet, in most team workflows, it gets reviewed once a week in a dashboard nobody acts on until ROAS drops.
The friction is usually organizational, not technical. Media buyers own the budget decisions. Creative teams own the assets. Neither group has a clear mandate to act on a thumbstop rate signal before it becomes a ROAS problem. The teams that close this gap, by building a shared creative performance dashboard with explicit rotation triggers, consistently outperform those that don’t.
One more thing worth saying: a high thumbstop rate is not the goal. It’s the entry condition. A 45% rate with a 10% hold rate means you baited the viewer and delivered nothing. The metric only means something when it’s paired with hold rate and conversion data. Optimize the whole diagnostic chain, not just the first number.
POPJAM helps you nail the hook before you go live
Knowing your thumbstop rate is one thing. Knowing which hook will win before you spend is another. That’s the gap POPJAM closes.
POPJAM generates on-brand video and static ad creatives, then tests them against synthetic buyer personas that mirror your actual cold audience. Before a single dollar goes to the auction, you get qualitative and quantitative feedback on which opening frames earn attention and which ones get scrolled past. The UGC variant wins? You know that on day one, not after $3,000 in wasted spend.
For agencies managing multiple clients, POPJAM’s AI ad generation platform handles creative volume and pre-launch validation in one workflow, so your team spends less time guessing and more time scaling what works. Ready to test your next hook before it goes live? Start your free trial at POPJAM.IO.
Useful sources for further reading
These are the primary sources behind the claims and benchmarks in this article. Each one is worth bookmarking if you’re building a creative performance practice.
- Motion: Thumbstop Rate and Hook Rate Glossary — Clean definition of thumbstop rate and hook rate as the same metric, with the formula and benchmark context. Good starting point for onboarding new team members.
- TigerTracks: Beyond the Scroll — Covers creative patterns that influence thumbstop rate across ad formats, including the benchmark bands used in this article.
- Video Ads Top: Thumbstop Rate and ROAS — Explains the relationship between thumbstop rate, CPM, and downstream ROAS. Useful for making the business case internally.
- Exactius Growth Library: Thumb-Stop Rate — Covers the static ad CTR proxy, the baiting trap, and practical decision rules. One of the more operationally useful references in this space.
- Exposure: Hook Rate vs Hold Rate — Clarifies the distinction between hook rate, hold rate, and view rate with formulas for each. Essential reading before building a creative diagnostic dashboard.
FAQ
What’s a good thumbstop rate?
A thumbstop rate of 20–29% is considered solid for cold-audience video on feed placements, 30%+ is strong, and 45%+ is exceptional. Benchmarks shift by placement, with Stories and full-screen formats typically yielding higher rates than standard feed.
How do you calculate thumbstop rate?
Divide 3-second video plays by total impressions and multiply by 100 to get thumbstop rate.
What is the thumb stop ratio?
Thumb stop ratio is another name for thumbstop rate, expressing the same calculation: the proportion of impressions that resulted in at least three seconds of viewing. It’s also used interchangeably with hook rate.
What does thumbstop mean in marketing?
In marketing, thumbstop refers to a creative’s ability to interrupt a user’s scroll and hold their attention for the opening seconds of a video ad. A high thumbstop rate signals that the first frame and opening hook are compelling enough to pause the viewer’s feed behavior.
How does POPJAM help improve thumbstop rate?
POPJAM tests hook variants against synthetic buyer personas before launch, predicting which opening frames will earn attention. This lets teams allocate budget to the strongest creative from day one rather than discovering the winner through expensive live testing.
Recommended
- Pre-Launch Creative Scorecard: 5 Checks Before You Spend | POPJAM | POPJAM.IO Blog
- Ad feedback analysis: Boost campaign ROI with data | POPJAM.IO Blog
- Creative Score: The AI Marketer’s Guide to Better Ads | POPJAM.IO Blog
- Free AI Ad Tools Ranked by What They Actually Do (2026) | POPJAM | POPJAM.IO Blog