

Creative Score: The AI Marketer's Guide to Better Ads
What is a creative score, and why does it matter?
A creative score is a single composite metric that predicts how well an ad creative will perform before it ever goes live. It aggregates 200+ behavioral science indicators covering visual attention, emotional resonance, message clarity, and conversion likelihood into one actionable number. Think of it as a pre-flight checklist for your ad spend.
This is not a vague quality rating. It is grounded in behavioral science and powered by AI models trained on real viewer behavior datasets. The result? You stop posting and praying, and start making decisions backed by data.
Here is what a creative score actually measures:
- Visual hierarchy: Are the most important elements placed where eyes naturally land?
- Message clarity: Does the headline communicate the value proposition within seconds?
- CTA effectiveness: Is the call-to-action prominent, specific, and compelling?
- Emotional resonance: Does the creative trigger the intended psychological response?
- Brand consistency: Are logo, color, and tone aligned with audience expectations?
For marketers running AI-generated ad creatives across Meta, Google, TikTok, or LinkedIn, a creative score turns subjective creative debates into objective, measurable decisions.
Table of Contents
- How AI, heatmaps, and synthetic audiences calculate your score
- Creative scores measure ads, not the people who make them
- The real benefits of creative scoring for your campaigns
- How POPJAM helps you optimize creative scores before launch
- What metrics actually go into calculating a creative score?
- Creative scoring in real marketing campaigns
- Limitations and biases you should know about
- How do creative scoring tools compare?
- POPJAM gives you the score and the fix
- Key Takeaways
How AI, heatmaps, and synthetic audiences calculate your score
The mechanics behind creative scoring are more sophisticated than a simple checklist. Modern platforms layer three distinct technologies to arrive at a composite score.

AI computer vision models analyze every element of your creative: font weight, color contrast, image composition, text density, and layout balance. These models are trained on human creativity ratings and real engagement data, so they predict viewer behavior with measurable accuracy.
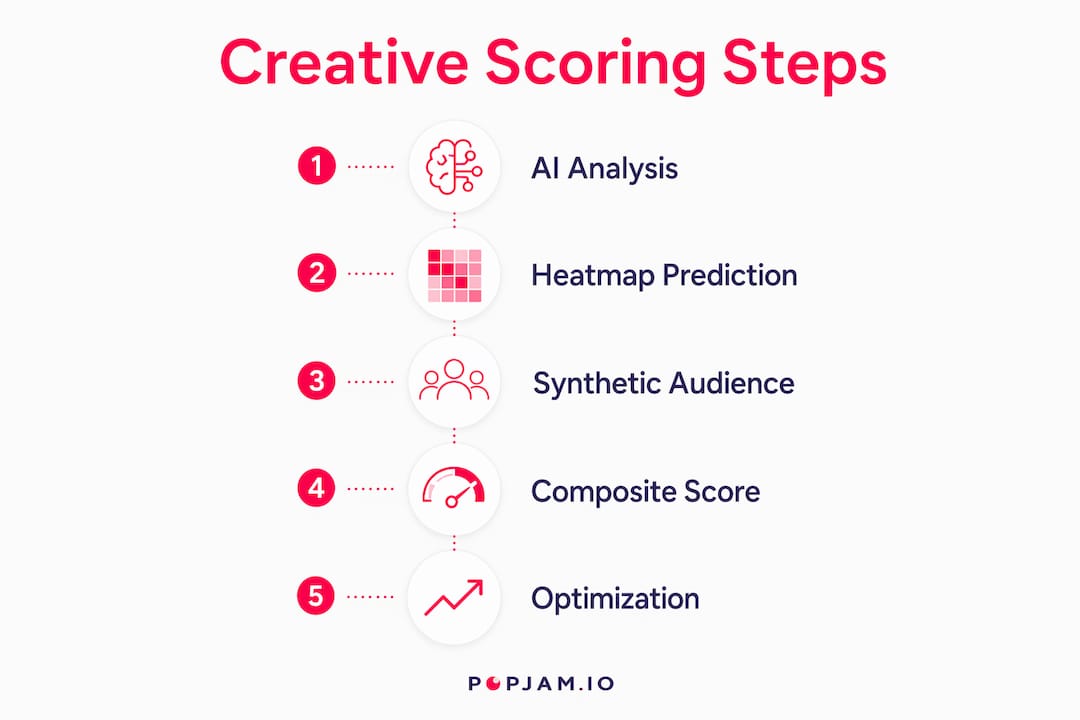
Heatmap technology maps predicted eye-tracking patterns across your creative. It identifies which zones attract attention first, how long viewers dwell on each element, and whether your CTA is landing in a high-attention area or getting buried. Heatmaps are especially powerful for catching problems a numeric score alone might miss, like a beautifully designed ad where the “Shop Now” button sits in a visual dead zone.
Synthetic audience simulations are where things get genuinely interesting. Instead of waiting for real campaign data, platforms simulate how specific psychographic segments will respond to your creative. You get qualitative feedback from AI-generated personas built on demographic, behavioral, and motivational profiles before a single dollar is spent.
These three layers combine into a composite creative score that reflects both the technical quality of your creative and its predicted audience impact. The best practice is to read heatmaps alongside the score: if a high-scoring creative still shows weak attention on your CTA, that is your signal to reposition it.
Creative scores measure ads, not the people who make them
This distinction matters more than most marketers realize. A creative score evaluates the output, not the creator. Academic psychology is clear on this: assessing creative products is a fundamentally different exercise from evaluating a person’s creative potential or personality.
Individual creativity assessment tools like EPoC or the Creative Profiler measure cognitive and conative traits such as divergent thinking, risk tolerance, and intrinsic motivation. These are useful for talent development and career counseling. A creative score does none of that.
What it does instead:
- Evaluates a specific asset’s predicted performance against behavioral benchmarks
- Produces an objective, repeatable measurement that does not shift based on who reviews it
- Removes the subjectivity that plagues traditional creative reviews
- Combines AI scoring with established behavioral science standards for higher reliability
Research confirms that triangulating multiple creative indicators yields more reliable evaluation outcomes than relying on any single method. That is exactly why composite creative scores outperform gut-feel creative reviews. Your team’s creative instincts are still valuable. A creative score just gives those instincts a reality check.
The real benefits of creative scoring for your campaigns
Let’s be direct: creative scoring changes how fast and how confidently you can move.
Faster iteration. When every creative gets a score before launch, you identify weak assets in hours, not weeks. No more waiting for campaign data to tell you what the AI already knew.
Smarter budget allocation. You push spend behind creatives with high scores and pull back on low scorers before they drain your budget. This directly reduces wasted ad spend and improves overall campaign efficiency.
Targeted fixes. A score breakdown tells you exactly what is underperforming. Weak CTA? Confusing headline? Poor visual hierarchy? You fix the specific problem instead of rebuilding the entire creative from scratch.
Creative fatigue management. By systematically scoring every asset, you build a library of what works for each audience segment. That data helps you rotate creatives strategically and avoid the performance cliff that comes from running the same ad too long.
Improved ROI. Better creatives, launched with confidence, perform better. It is that straightforward. For data-driven ad creatives, the scoring process is not an extra step. It is the step that makes every other step more effective.
How POPJAM helps you optimize creative scores before launch
POPJAM is built specifically for this workflow. Upload your creative, and the platform runs it through AI analysis, heatmap generation, and synthetic persona simulations simultaneously. You get a creative score, a visual attention map, and qualitative feedback from AI-generated buyer personas, all before your campaign goes live.
Here is how the process works in practice:
- Upload your asset: Images, video, animation, social posts, or email creatives across Meta, Google, TikTok, LinkedIn, and Reddit are all supported.
- Select your synthetic personas: Choose from psychographic profiles that match your actual target segments, built on behavioral and motivational data.
- Review your score and heatmap: See exactly where attention lands, where it drops off, and how your CTA is performing visually.
- Read the qualitative feedback: POPJAM’s synthetic buyer personas surface the “why” behind the score, giving you the psychographic context to make smarter creative decisions.
- Iterate and re-score: Adjust headlines, reposition CTAs, swap visuals, and re-run the simulation until your score reflects a creative ready to perform.
POPJAM democratizes enterprise-grade creative analysis for teams of any size, cutting testing timelines and costs that traditionally required large research budgets. For agencies managing multiple clients, the platform’s GDPR-compliant simulation means you can run audience testing without collecting real user data.
Pro Tip: Use POPJAM’s heatmap alongside the numeric score on every creative. A high score with a weak CTA attention zone is a fixable problem. A low score with strong attention patterns tells you the concept is right but the execution needs work.
For a structured pre-launch process, the pre-launch creative scorecard framework gives you five concrete checks to run before any spend goes out the door.
What metrics actually go into calculating a creative score?
The methodologies behind creative scoring draw from behavioral science, computer vision, and predictive analytics. Understanding the inputs helps you interpret the output more intelligently.
| Metric Category | What It Measures |
|---|---|
| Visual attention | Predicted eye-tracking zones and dwell time |
| Message clarity | Readability score, headline specificity, information hierarchy |
| Emotional resonance | Sentiment alignment with audience psychographic profiles |
| CTA strength | Placement, contrast, specificity, and urgency signals |
| Brand consistency | Logo visibility, color palette adherence, tone alignment |
| Composition balance | Layout symmetry, whitespace use, element density |
Platforms combine these inputs using weighted models trained on real campaign performance data. The weighting varies by platform and ad format, which is why a creative score for a TikTok video may weight motion and audio cues differently than a static Meta image ad.
Creative scoring in real marketing campaigns
Creative scoring is not theoretical. Here is how it shows up in actual campaign workflows.
An e-commerce brand running seasonal promotions uses creative scoring to pre-test six ad variants before launch. The platform flags two variants with low CTA visibility scores. The team repositions the button, re-scores, and launches only the top three performers. The result is a tighter creative set with higher predicted engagement from day one.
A SaaS company testing a new feature announcement uses synthetic persona simulations to check how their messaging lands with two distinct buyer segments: growth-focused marketers and cost-conscious operations leads. The scores diverge significantly, revealing that the headline resonates with one segment but confuses the other. They split the campaign with tailored copy for each group.
Agencies use high-impact ad creative scoring to standardize quality across client accounts. Instead of relying on individual creative directors’ judgment, every asset gets an objective score before it goes to the client for approval. This reduces revision cycles and builds client confidence in the agency’s process.
Limitations and biases you should know about
AI-driven creative scoring is powerful, but it is not perfect. Knowing the limitations makes you a smarter user of the data.
Training data bias. Scoring models trained predominantly on certain demographics, industries, or ad formats may underperform when applied to niche audiences or unconventional creative styles. A score calibrated on direct-response e-commerce ads may not accurately predict performance for brand awareness campaigns.
Cultural context gaps. Visual and linguistic cues that resonate in one cultural context can fall flat or misfire in another. AI models do not always capture these nuances, particularly for regional U.S. markets with distinct cultural identities.
Format limitations. Most scoring platforms handle static images well. Video, interactive formats, and audio-heavy creatives are harder to score accurately because the behavioral models are less mature for those formats.
Over-reliance risk. A high creative score does not guarantee campaign success. Targeting, bidding strategy, landing page quality, and offer strength all influence outcomes. The score predicts creative performance in isolation, not the full funnel.
Use creative scores as a strong signal, not the only signal. Pair them with key marketing metrics like click-through rate, conversion rate, and cost per acquisition to build a complete picture.
How do creative scoring tools compare?
The market for creative scoring tools ranges from standalone scoring utilities to full creative generation and testing platforms. Here is how the main categories stack up:
Standalone scoring tools take your existing creative and return a score with basic recommendations. They are fast and low-cost but offer limited depth. You get the number without much context for how to act on it.
AI creative suites with integrated scoring generate creatives and score them within the same workflow. This is where the real efficiency gain lives. You are not shuttling files between tools; the scoring is part of the creation process. For a full breakdown of what is available, the 2026 AI creative suite guide covers the leading options in detail.
Synthetic audience platforms add the psychographic layer that pure scoring tools miss. They simulate how specific buyer personas respond to your creative, giving you qualitative feedback alongside the quantitative score. This is the most complete approach for teams that need to understand the “why” behind a score, not just the number.
POPJAM sits in this third category. It combines AI creative generation, composite scoring, heatmap analysis, and synthetic persona simulation in one platform, making it the most complete option for marketers who want to test before they spend. For visual storytelling that actually converts, having all three layers in one place removes the friction that slows most teams down.
POPJAM gives you the score and the fix
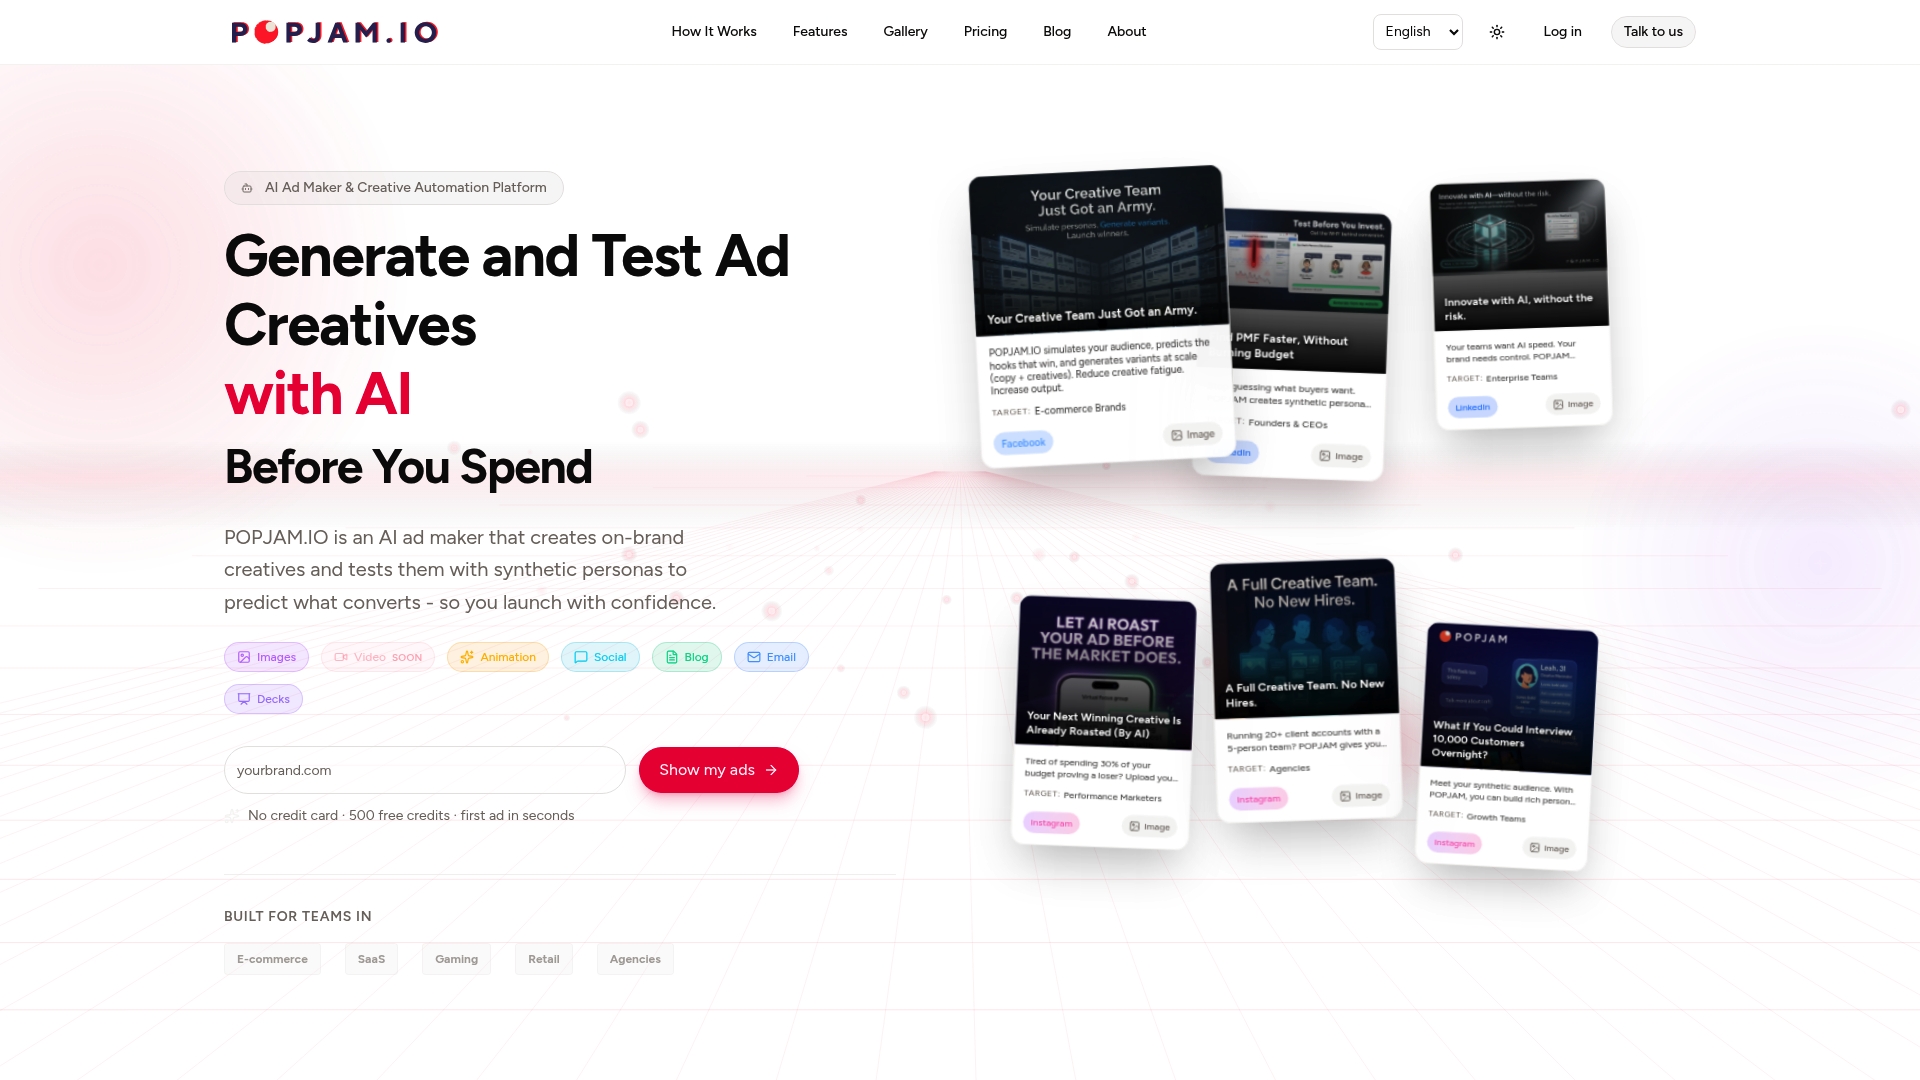
Most creative scoring tools tell you what is wrong. POPJAM tells you what is wrong and shows you how to fix it, with AI-generated creative alternatives scored in real time. For e-commerce brands, SaaS teams, and agencies tired of launching ads and hoping for the best, that is a meaningful difference.
You upload your creative, get a composite score backed by 200+ behavioral indicators, see exactly where attention lands on your heatmap, and hear directly from synthetic buyer personas built on your actual audience’s psychographic profile. No guesswork. No waiting for live campaign data to confirm what the AI already predicted.
POPJAM is built for teams that want to move fast without burning budget on underperforming creatives. Whether you are running campaigns on Meta, TikTok, Google, or LinkedIn, the platform covers every major format and channel.
Ready to see your creative score before you spend? Test your first creative on POPJAM and find out exactly what your audience will respond to.
Key Takeaways
A creative score is the single most reliable pre-launch signal for ad performance, combining AI analysis, heatmap data, and synthetic audience feedback into one actionable metric.
| Point | Details |
|---|---|
| What a creative score measures | A composite of 200+ behavioral science indicators predicting ad engagement, clarity, and conversion potential. |
| Scores evaluate assets, not creators | Creative scoring measures marketing content effectiveness, not the personal creativity of the people who made it. |
| Three core inputs | AI computer vision, heatmap attention mapping, and synthetic persona simulations combine into one composite score. |
| Key limitation to watch | Training data bias and cultural context gaps mean scores are strong signals, not guarantees of campaign success. |
| POPJAM’s role | POPJAM generates, scores, and simulates audience reactions in one platform, so you test before you spend. |