

47% More ROI for Performance Marketers: Creative Analytics Pretesting
Creative analytics is the practice of measuring which specific elements inside an ad, the hook, the CTA, the imagery, the pacing, actually drive results, instead of just tracking whether the campaign as a whole performed. For performance marketers, the payoff is direct: faster creative validation, less wasted spend, and campaigns that improve because you know why an ad worked, not just that it did. Keep reading for the framework and checklist that make it operational.
TL;DR:
- Creative analytics identifies which specific ad elements, such as hooks and CTAs, directly influence performance metrics like ROAS and conversions.
- Proper data consolidation from multiple platforms, behavioral signals, and synthetic feedback is essential to accurately assess creative effectiveness.
- Testing creatives before live deployment through synthetic personas significantly improves ROI, reducing wasted spend and enabling faster optimization.
- Successful implementation requires consistent tagging, a centralized data pipeline, clear decision ownership, and regular review cadences to prevent data fragmentation.
- Privacy considerations demand careful handling of first-party behavioral data, especially under GDPR and CCPA, while synthetic testing offers a privacy-friendly alternative.
Table of Contents
- What Is Creative Analytics, Exactly?
- Why Data-Driven Creative Wins on CTR and ROAS
- Where Do Creative Analytics Data Come From?
- Which KPIs Actually Tell You Something?
- How Does the Four-Stage Analytics Framework Work?
- How Do You Actually Set This Up?
- What Usually Goes Wrong?
- How POPJAM Applies Creative Analytics in Practice
- When Should You Actually Invest In This?
- What About Privacy When Analyzing Creative Data?
- AI Should Sharpen Creative Judgment, Not Replace It
- Test Creatives Before They Cost You Anything
- Sources
- FAQ
What Is Creative Analytics, Exactly?
Creative analytics tells you which three seconds of the video, which headline, and which CTA button color drove that return, and which ones dragged it down. That’s the entire difference: campaign-level reporting aggregates performance, while creative analytics isolates it at the asset level, down to individual frames, copy variants, and visual treatments.
Marketers typically break creative elements into a handful of components worth analyzing separately:
- The hook: the first 1 to 3 seconds of a video or the headline of a static ad
- The opening frame: the first visual a scroller sees before they decide to keep watching
- The CTA: wording, placement, and visual weight
- Imagery and color: product shots versus lifestyle shots, bright versus muted palettes
- Copy tone: urgency-driven versus benefit-driven versus social-proof-driven language
You don’t need creative analytics for every campaign. It earns its keep on always-on paid social budgets, high-frequency testing cadences, and any account spending enough that a 10% CTR swing moves real dollars. A one-off $500 test doesn’t need this rigor. A $50,000 monthly Meta budget absolutely does.
Why Data-Driven Creative Wins on CTR and ROAS
The business case is not theoretical. Capgemini’s research found that data-driven, real-time creative ads produced substantially higher click-through rates than conventional still-image ads, with some brands seeing significant growth in digital coupon usage after switching to data-informed creative production.
Statistic Callout: Data-driven, real-time creative can drive close to 300% higher CTR than static, conventional ads, according to Capgemini.
Beyond the headline number, the operational benefits compound:
- Faster validation: you know within days, not weeks, whether a concept resonates
- Sharper creative briefs: past performance data tells your team what to brief for next, instead of guessing
- Less wasted production spend: you stop paying for full video shoots around concepts that never had a real signal behind them
For performance marketers, prioritize benefits that hit CPA and revenue directly first: faster kill/scale decisions on underperforming variants matter more than aesthetic polish. A creative that lowers CPA by 15% is worth more attention than one that simply looks better in a deck.
Where Do Creative Analytics Data Come From?
Consolidating creative data is the part most teams get wrong. Signals live in at least three different places, and none of them talk to each other by default.
- Platform-native metrics: impressions, CTR, watch time, thumbstop rate, and conversions broken out per creative variant, pulled from Meta Ads Manager, TikTok Ads Manager, Google Ads, and similar dashboards.
- First-party behavioral data: what happens after the click. On-site session behavior, add-to-cart rate, and post-click conversion data tell you whether a high-CTR ad is actually attracting buyers or just curious clickers.
- Qualitative and synthetic feedback: surveys, heatmaps, and increasingly, synthetic persona testing that simulates how different audience segments react to a creative before it ever spends a dollar.
- Unstructured signals: modern tooling can now parse video frames, on-screen text, and even social comments as structured data, which widens what counts as a measurable creative signal, per AWS’s overview of advanced analytics.
The practical fix for fragmentation is consistent tagging. Every creative variant needs a naming convention that survives being uploaded across five ad platforms, plus a central data store or BI layer that pulls from all of them. Without that, you’re reconciling spreadsheets by hand every Friday, and nobody has time for that.
Which KPIs Actually Tell You Something?
Not every metric deserves equal weight. A creative can have a great CTR and still be a bad creative if nobody converts after clicking. The trick is layering primary, secondary, and diagnostic metrics so you’re never making a call off one number in isolation.
| Metric tier | Metric | What it tells you |
|---|---|---|
| Primary | ROAS | Whether the creative generates profitable revenue |
| Primary | Conversions | Raw volume of the outcome you actually want |
| Secondary | CTR | Whether the hook and thumbnail earn attention |
| Secondary | Thumbstop rate | Whether video stops the scroll in the first few seconds |
| Diagnostic | Watch time / completion rate | Whether the middle of the ad holds interest or loses it |
| Diagnostic | CPA | Cost efficiency relative to the account’s target |
Cutting a creative on day one because CTR looks soft is how good ads die of impatience. Sampling too small a window, especially over a weekend when behavior skews differently than weekdays, is one of the fastest ways to act on a false positive.
How Does the Four-Stage Analytics Framework Work?
Harvard Business School’s framework for data analysis maps cleanly onto creative performance work, moving from “what happened” to “what should we do next.”
- Descriptive: what happened. CTR dropped 20% in week two of this campaign.
- Diagnostic: why it happened. A frame-by-frame breakdown shows viewer drop-off spikes at the 4-second mark, right when the CTA first appears on screen.
- Predictive: what’s likely to happen next. Based on similar past creatives, this variant will likely keep declining without a hook refresh.
- Prescriptive: what to do about it. Swap the opening frame, move the CTA to the 7-second mark, and relaunch as a new variant.
Walking one ad through all four stages usually takes under a week once the tagging and reporting are in place. The trap is over-analyzing: teams sometimes build increasingly elaborate diagnostic models chasing a 2% variance that spend alone won’t fix.
Pro Tip: Once you have a clear diagnostic answer and a plausible fix, ship the new variant. Don’t keep layering predictive models on a problem you already understand well enough to act on.
How Do You Actually Set This Up?
Operationalizing creative analytics isn’t a six-month initiative. It’s five decisions, made once and then followed consistently.
- Build a tagging convention first. Every creative gets a unique ID encoding format, hook type, and campaign objective before it ever launches. Retrofitting tags onto months of historical creative is painful; starting clean isn’t.
- Pick a data pipeline category, not a specific vendor. You need something that pulls platform APIs into a central warehouse or BI dashboard on a schedule, whether that’s a lightweight spreadsheet-connector tool or a full data warehouse setup.
- Design experiments with a minimum detectable effect in mind. Decide in advance how big a CTR or ROAS lift needs to be before you’ll act on it, so you’re not chasing statistical noise.
- Assign a decision owner. Someone specific signs off on kill/scale calls, not a committee. Ambiguity here is where good data dies in a Slack thread.
- Set a review cadence. Weekly for high-spend, always-on accounts; biweekly or monthly for lower-velocity campaigns.
A tool like POPJAM’s creative performance analysis approach can help map creative elements to outcomes automatically, which removes a lot of the manual tagging burden from step one.
What Usually Goes Wrong?
Even well-intentioned rollouts hit predictable snags.
- Fragmented attribution windows: Meta’s 7-day click window doesn’t match TikTok’s, and neither matches your CRM’s post-purchase tracking, so cross-platform comparisons get murky fast.
- Creative fatigue and variant explosion: teams generate 40 variants to test, then can’t staff the analysis to actually learn from all of them.
- Friction between creative and measurement teams: designers hear “the data says no” as a verdict on their taste, not a signal about audience behavior, and that tension kills adoption.
The fixes are mostly cultural, not technical. Standardize on one attribution model as your source of truth even if it’s imperfect, cap variant counts to what your team can actually review weekly, and involve creative leads in reading the diagnostic data directly instead of just receiving conclusions secondhand.
How POPJAM Applies Creative Analytics in Practice
POPJAM was built around a simple idea: test the creative before it ever spends a dollar of media budget, not after. The workflow runs in four steps. First, generate on-brand ad creatives directly in the platform. Second, simulate audience reactions using synthetic personas built from psychographic profiles rather than just demographics. Third, measure qualitative and quantitative feedback on hook strength, messaging clarity, and visual appeal before launch. Fourth, iterate based on that feedback and relaunch a sharper version.
Publisher data from POPJAM indicates that data-backed creatives, ads refined through this pretest-and-iterate cycle, boost campaign ROI by roughly 47% compared to creatives launched without pretesting.
Statistic Callout: POPJAM’s internal data points to a 47% ROI lift when creatives go through synthetic persona testing before launch.
That gap matters because it happens before spend, not after a costly week of live testing tells you the same thing the hard way.
When Should You Actually Invest In This?
Invest once you’re running more than a handful of active variants a month, or once a single bad creative week costs more than a data analyst’s time would. The short-term outcome is faster kill/scale decisions and fewer wasted production dollars. Medium-term, expect sharper creative briefs and a real drop in cost per acquisition as your team learns what actually works for your audience. The next tactical step: pick one campaign, design a small pilot test with two or three variants, tag them properly, and run the four-stage framework on the results before scaling the practice further.

What About Privacy When Analyzing Creative Data?
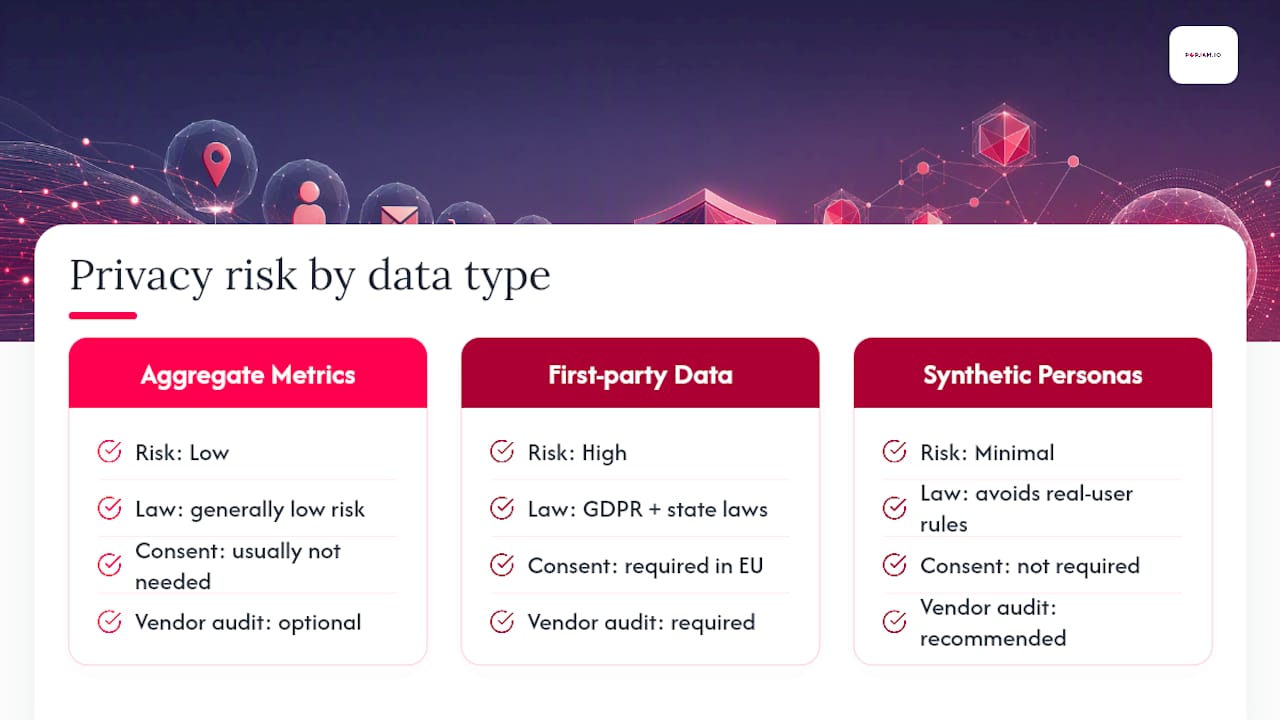
Creative analytics runs on behavioral and sometimes personal data, which means privacy rules apply even when the goal is just “which ad hook works better.” Platform-level metrics like impressions and CTR are generally aggregate and low-risk, but first-party behavioral data, on-site session tracking, post-click conversion data tied to individual users, carries real compliance obligations.
If you’re collecting or processing data from users in the EU or EEA, GDPR governs consent, storage, and processing regardless of where your business is headquartered. That means clear consent mechanisms before tracking, documented data retention policies, and the ability to honor deletion requests. In the United States, requirements vary by state, with laws like the California Consumer Privacy Act imposing similar consent and disclosure obligations for businesses meeting certain thresholds.
Synthetic persona testing sidesteps a chunk of this risk entirely, since simulating audience reactions doesn’t require harvesting real user data to run the test. That’s a meaningful advantage when you’re trying to move fast on creative iteration without building a parallel compliance review for every test.
Practically, this means auditing which vendors in your creative analytics stack actually touch personal data versus aggregate platform metrics, and treating the two categories differently in your data governance policy. Not every signal in your pipeline carries the same regulatory weight, and treating them as if they do just slows your team down without adding real protection.
AI Should Sharpen Creative Judgment, Not Replace It
The best use of AI in this work isn’t generating an ad and calling it done. It’s using AI to surface patterns a human would take weeks to spot manually, then letting a creative director decide what to do with that pattern. Experts at Asylum/AI describe this well: AI functions best as a “data archaeologist,” uncovering signal and validating prototypes rather than dictating final creative direction.
Three principles keep this useful instead of reckless: let AI test and validate, but keep a human making the final call on brand voice; be transparent internally about what’s synthetic feedback versus real customer data; and treat any AI output as a draft worth scrutinizing, not a finished decision. Readers ready to put this into practice can start with POPJAM’s ad testing tool.
— Doruk
Test Creatives Before They Cost You Anything
Most teams find out which ad hook works by running it live and watching the CPA climb before anyone catches the problem. POPJAM flips that order: you generate on-brand creatives inside the platform, run them against synthetic personas built from real psychographic profiles, and see what resonates before a single dollar hits Meta, Google, TikTok, or Reddit.

That pretest step is what separates guesswork from the four-stage framework covered above, with descriptive and diagnostic work happening before launch instead of after the budget’s already spent. Whether you’re running e-commerce campaigns, managing SaaS acquisition, or handling creative across multiple agency clients, the workflow is the same: generate, simulate, measure, iterate.
Start with the AI ad generator and run your next creative through a synthetic audience test before it goes live.
Sources
- Data-driven and real-time marketing: The perfect mix of creativity and data - Capgemini
- 4 Types of Data Analytics to Improve Decision-Making - Harvard Business School Online
FAQ
What does a creative analyst do?
A creative analyst measures which specific elements of an ad, hooks, visuals, copy, CTAs, drive performance, then translates those findings into briefs and testing recommendations for the creative team.
What are the four main types of marketing analytics?
The four types are descriptive (what happened), diagnostic (why it happened), predictive (what’s likely to happen next), and prescriptive (what to do about it), a sequence popularized by Harvard Business School for turning data into decisions.
What is analytics in simple words?
Analytics is the practice of examining data to find patterns and answer specific questions, in a marketing context, that usually means figuring out what’s working and why.
What does a creative marketing person do?
A creative marketing person develops the concepts, copy, and visuals behind campaigns, and increasingly works alongside creative analytics data to know which ideas are worth producing at scale, a process platforms like POPJAM are built to speed up.