

Ad Spend Optimization for Performance Marketers
The fastest way to cut wasted ad spend and lift ROAS right now is to treat optimization as a continuous, portfolio-level discipline, not a quarterly audit. Fix your measurement gaps first, cut identifiable waste second, and redeploy budget to proven ROAS pockets third. Before you touch a single bid, run three checks: confirm server-side conversions are firing (not just browser pixels), pull your placement report and flag the bottom three by CPA, and verify at least one creative pre-test is running in your current campaign cadence. Tools like GA4 for measurement and POPJAM for creative pre-testing belong in that workflow from day one.
Quick stat: Industry analysis shows that a material share of digital ad spend is lost to low-quality traffic and configuration errors. Fixing tracking gaps and eliminating poor placements can produce measurable ROI improvement without increasing total budget.
Performance marketing is outcome-driven by design. It focuses on measurable actions and near-real-time optimization, which means your data quality is the ceiling on everything else. If your signals are broken, your bidding algorithms are flying blind, and no amount of creative testing will save you.
Key Takeaways
Effective ad spend optimization combines measurement hardening, portfolio-level budget rules, and AI creative pre-testing to cut waste and redeploy budget toward channels with proven ROAS.
| Point | Details |
|---|---|
| Fix measurement first | Server-side tagging and CAPI recover lost conversion signals before any reallocation decision is reliable. |
| Cut placements, not channels | Pause the bottom three placements by CPA each week before touching channel-level budgets. |
| Pre-test creatives before launch | Running creatives through synthetic persona testing in POPJAM reduces early-stage waste and improves live A/B baselines. |
| Apply percent-move guardrails | Move no more than 15–25% of any channel’s budget per reallocation cycle to protect algorithm learning. |
| Make optimization a weekly habit | A 30-minute weekly checklist covering tag health, creative inventory, and experiment status is more valuable than a quarterly audit. |
Table of Contents
- What is ad spend optimization, exactly?
- What are the highest-impact ad spend optimization strategies?
- Which KPIs should you track, and how often?
- How do you make your tracking reliable before reallocating budget?
- How should you design tests to validate budget reallocations?
- What does a repeatable budget reallocation process look like?
- Which tools belong in your optimization tech stack?
- How does AI creative pre-testing actually reduce wasted spend?
- What benchmarks should you use to set realistic targets?
- How do you handle cross-channel attribution in omni-channel campaigns?
- What does a one-page optimization playbook look like?
- A practitioner’s take on what actually works
- POPJAM cuts creative waste before your budget pays for it
- Sources
- FAQ
What is ad spend optimization, exactly?
Ad spend optimization is the ongoing process of reallocating advertising budget toward the channels, placements, audiences, and creatives that generate the highest return, while cutting or pausing the ones that drain budget without producing measurable outcomes. The formal industry term is media spend optimization, and it treats your entire media portfolio as an interconnected system rather than a collection of isolated campaigns.
Mailchimp’s media spend guidance frames it well: optimization is continuous and data-driven, not a one-time fix. You’re not looking for a single lever to pull. You’re building a repeatable process that moves money in near real time toward revenue-driving channels.
The practical scope covers four workstreams: measurement hardening (so your data is trustworthy), waste elimination (cutting placements, audiences, and creatives that underperform), budget reallocation (moving freed-up spend to high-ROAS pockets), and creative testing (validating new assets before they consume live budget).
What are the highest-impact ad spend optimization strategies?
Here’s a prioritized checklist you can work through this week, ordered by speed of impact and ease of implementation.
-
Recover server-side conversion signals. Browser pixels lose a significant portion of events to ad blockers and iOS restrictions. Implement server-side tagging via Google Tag Manager server container or a tool like Stape, and enable Meta’s Conversion API (CAPI) alongside your pixel. This is the single highest-leverage fix because every downstream optimization depends on clean signal.
-
Exclude your bottom three placements by CPA. Pull a placement-level report in Google Ads and Meta Ads Manager. Sort by CPA descending. The bottom three placements commonly consume a notable share of budget with conversion rates far below account average. Pause them today.
-
Add negative keywords to every search campaign. Run a search term report weekly. Any term with more than $50 in spend and zero conversions is a candidate for negation. This is the cheapest, fastest PPC campaign optimization available.
-
Set bid guardrails before enabling Smart Bidding. Google Ads’ Target CPA and Target ROAS work well, but only with sufficient conversion volume (Google recommends at least a moderate number of conversions per month per campaign). Set a max CPC cap as a guardrail during the algorithm’s learning phase. Without it, Smart Bidding can spike CPCs during the learning phase.
-
Run a creative pre-test before launching new assets. Most teams launch creatives and let the platform decide winners over two to three weeks of live spend. Pre-testing against synthetic buyer personas, as POPJAM does, surfaces the likely losers before they consume budget. Feed only your top-scoring creatives into live campaigns.
-
Apply dayparting based on conversion data, not assumptions. Pull an hourly performance report over 30 days. If conversions cluster between 8 AM and 8 PM on weekdays, reduce bids by 30–50% outside those windows. Don’t guess, let the data set the schedule.
-
Trim geographic targeting to your highest-converting regions. Sort campaigns by state or DMA. Regions with CPAs more than 2x your target average are candidates for bid reduction or exclusion. Reallocate that budget to your top-converting geos.
-
Segment audiences by conversion intent, not just demographics. Broad audiences lower CPMs but can wreck CPA if your conversion signal is weak. Use first-party data seeds (customer lists, CRM uploads) to build lookalike audiences that the algorithm can actually learn from. Audience segmentation analysis consistently shows that intent-based segments outperform demographic-only targeting on CPA.
-
Implement micro-conversion tracking. If your primary conversion is a purchase or a demo request, add micro-conversions (add-to-cart, video view 75%, form start) as secondary signals. This gives Smart Bidding more data to work with and helps you spot funnel drop-off points before they become budget problems.
-
Test asset-level performance in Google Ads responsive ads. Responsive search ads and Performance Max campaigns report asset-level ratings (Low/Good/Best). Swap out “Low” assets every two weeks. Don’t wait for the platform to deprioritize them on its own.
-
Review automated budget pacing rules. Google averages daily budgets across a calendar month, which means a campaign can overspend on high-traffic days and underspend on slow ones. Set monthly budget caps at the campaign level and review pacing weekly, not monthly.
-
Build a budget reserve for exploratory channels. Reserve 10–15% of total media budget for testing new channels or formats. This prevents the “all-in on what’s working” trap that leaves you exposed when a top channel’s performance degrades.
Your 48-hour action list:
- Run a tag audit in GA4 and confirm server-side events are firing
- Pull placement reports in Google Ads and Meta Ads Manager, pause the bottom three by CPA
- Launch one creative pre-test in POPJAM before your next campaign goes live
Pro Tip: The most common misapplication of dayparting is setting it based on click volume instead of conversion data. Clicks peak in the morning; conversions often peak in the evening. Always use conversion time, not click time, as your scheduling anchor.
Which KPIs should you track, and how often?
| Metric | Formula | Why It Matters | Monitoring Cadence |
|---|---|---|---|
| ROAS | Revenue / Ad Spend | Primary efficiency signal for e-commerce | Daily |
| CPA / CPL | Ad Spend / Conversions | Core efficiency metric for lead gen and SaaS | Daily |
| LTV / CLV | Avg. Order Value x Purchase Frequency x Lifespan | Sets the true CPA ceiling for subscription models | Monthly |
| Conversion Rate | Conversions / Clicks | Diagnoses landing page and audience quality issues | Weekly |
| CPM | (Ad Spend / Impressions) x 1000 | Signals auction competitiveness and audience saturation | Weekly |
| CTR | Clicks / Impressions | Creative relevance and audience match indicator | Weekly |
| Incrementality Lift | (Conversion Rate Test Group - Control Group) / Control Group | Measures true causal impact of spend | Per experiment |
Metric prioritization by objective:
- Lead gen campaigns: CPA/CPL is your north star. ROAS is secondary.
- E-commerce campaigns: ROAS drives daily decisions; LTV-adjusted CPA sets your scaling ceiling.
- Subscription / SaaS: LTV-driven CPA is the only metric that justifies aggressive top-of-funnel spend. A $200 CPA looks terrible until you know LTV is $1,800.
When a KPI triggers a reallocation decision:
- CPA exceeds 2x target for 7+ consecutive days: pause or restructure the ad set
- ROAS drops below 1.5x for 14+ days with no external explanation: reallocate 25% of budget to top-performing campaigns
- CTR falls below 0.5% on display or social: creative fatigue, refresh assets immediately
- Incrementality lift is negative or near zero: the channel may be claiming credit for organic conversions, not driving new ones
Analyzing ROAS reports at the placement and audience level, not just the campaign level, is where most teams find their biggest reallocation opportunities.
How do you make your tracking reliable before reallocating budget?
Bad data produces confident wrong decisions. Harden your measurement stack before you move a dollar.
Implementation checklist:
- Server-side tagging: Deploy a server-side Google Tag Manager container (Stape is a widely used managed option) to route events through your own domain. This recovers signal lost to browser restrictions and improves data accuracy for Smart Bidding.
- Google Enhanced Conversions: Upload hashed first-party data (email, phone) alongside standard conversion events. This fills gaps left by cookie loss and improves match rates in Google Ads.
- Meta Conversion API (CAPI): Run CAPI in parallel with your Meta pixel. Use event deduplication to avoid double-counting. CAPI recovers iOS-blocked events and improves Meta’s delivery optimization.
- CRM data stitching: Connect your CRM (HubSpot, Salesforce, or similar) to your ad platforms via offline conversion imports. This closes the loop between ad clicks and actual revenue, not just form fills.
- GA4 as your cross-channel source of truth: Configure GA4 with server-side events, set up custom dimensions for campaign parameters, and use the Advertising workspace to reconcile platform-reported conversions against GA4’s independent count.
How to reconcile platform reports with unified dashboards:
- Pull platform-reported conversions from Google Ads, Meta Ads, and any other active channels.
- Compare against GA4’s session-based conversion count for the same period.
- Calculate the discrepancy ratio. A ratio above 1.3x (platforms claiming 30% more conversions than GA4 records) is a red flag for attribution overlap.
- For complex omni-channel campaigns, layer in Marketing Mix Modeling (MMM) or probabilistic attribution to fill the gaps that last-click and even data-driven attribution miss.
Adobe’s performance marketing guidance is direct on this: due to privacy changes and signal loss, top-performing teams rely on server-side tracking, first-party data, and modeling to reconstruct performance signals and enable AI-driven optimization. Platform-native reporting alone is no longer sufficient.
How should you design tests to validate budget reallocations?
Every reallocation should be a hypothesis, not a gut call. Here’s the experiment flow that holds up under scrutiny.
-
Write a falsifiable hypothesis. Example: “Shifting 20% of budget from broad audience campaigns to first-party lookalike campaigns will reduce CPA by 15% within 21 days, holding creative constant.”
-
Size your sample before you start. Use a statistical power calculator (Google’s own or a tool like Evan Miller’s sample size calculator). For most CPA tests, you need at least 100 conversions per variant to detect a 15–20% difference at 95% confidence. If you can’t hit that threshold in 21 days, the test is underpowered and the result is noise.
-
Choose your split or holdout design. For creative tests, use A/B splits within a single campaign. For budget reallocation tests, use a geographic holdout: run the new allocation in one region, hold the old allocation in a comparable region, and compare incrementality lift.
-
Set a fixed run window before you start. Minimum 14 days to capture weekly seasonality patterns. Don’t peek at results on day 3 and declare a winner. Peeking inflates false positive rates significantly.
-
Check statistical significance at the end of the window, not before. A result is actionable when p < 0.05 and the confidence interval on the lift estimate doesn’t cross zero. If it does, extend the run window or accept that the effect is too small to measure reliably.
-
Interpret results in context. A winning variant in a holdout test still needs a sanity check: did anything else change during the test window (a competitor’s promotion, a platform algorithm update, a seasonal spike)? If yes, flag the confound before scaling.
Common pitfalls:
- Changing creative and audience simultaneously in the same test (you can’t isolate the cause of any result)
- Running tests during high-volatility periods like Black Friday without a seasonality adjustment
- Declaring significance on micro-conversions and scaling as if they were purchase conversions
Pro Tip: Run a creative pre-test in POPJAM before the live A/B. Synthetic persona feedback surfaces likely losers in hours, not weeks. Feed only your top-scoring creatives into the live experiment, and your A/B starts with a much higher baseline. The platform’s learning phase gets better inputs, and you waste less budget on variants that were never going to win.
What does a repeatable budget reallocation process look like?
Optimization without governance is just chaos with a dashboard. Here’s the process that keeps teams aligned and moving.
Process cadence:
- Weekly signal check (30 minutes, performance marketer): Review CPA, ROAS, and CTR by campaign. Flag any campaign breaching guardrail thresholds. Log findings in a shared doc.
- Biweekly experiment review (60 minutes, performance marketer + growth lead): Review all running tests. Close tests that have hit their run window. Document results and recommended actions.
- Monthly portfolio reallocation meeting (90 minutes, marketing manager + finance stakeholder): Review the full channel portfolio. Approve budget moves above 15% of any channel’s allocation. Set next month’s exploratory budget reserve.
Guardrail rules:
- Move no more than 15–25% of a channel’s budget in a single cycle. Larger moves destabilize algorithm learning.
- Require a minimum of 50 conversions in the last 30 days before scaling a campaign. Below that threshold, the data isn’t reliable enough to justify increased spend.
- After a large budget increase (more than 20%), enforce a 7-day cooling-off window before evaluating performance. Smart Bidding needs time to recalibrate.
- Never cut a channel to zero based on a single bad week. Require two consecutive weeks of underperformance before pausing.
Example allocation decisions:
- A display retargeting campaign has a CPA 3x the target for 14 days. Cut budget substantially and reallocate to paid search branded campaigns with significantly higher ROAS.
- A new LinkedIn campaign is in its first 30 days with only 20 conversions. Hold budget steady, don’t scale yet.
- Q4 is approaching. Increase exploratory budget reserve from 10% to 15% to test new creative formats before peak season.
Google’s guidance on budget pacing notes that campaigns can overspend on high-traffic days within a monthly average. Monthly caps at the campaign level prevent this from distorting your reallocation math.
Which tools belong in your optimization tech stack?
The right stack depends on your monthly media budget and your privacy posture. Here’s how to think about it by category.
Bidding and campaign management:
- Google Ads Smart Bidding (Target CPA, Target ROAS, Maximize Conversions): works well at 30+ conversions per month per campaign. Below that threshold, manual CPC with bid adjustments is more predictable.
- Meta Ads Manager Advantage+ campaigns: best for e-commerce with a large product catalog and strong first-party data. Requires CAPI to perform well post-iOS 14.
Analytics and attribution:
- GA4: cross-channel measurement, funnel analysis, and audience building. The non-negotiable foundation for any multi-channel setup.
- Stape: managed server-side tagging that routes events through your own domain. Reduces implementation complexity for teams without dedicated engineering resources.
- Marketing Mix Modeling tools (Meridian by Google, Robyn by Meta): for budgets above $100k/month where platform-reported attribution is materially unreliable.
Creative pre-testing:
- POPJAM: generates on-brand ad creatives and tests them against synthetic buyer personas before launch. Surfaces psychographic feedback on images, video, and copy across Meta, Google, TikTok, LinkedIn, and Reddit. Particularly useful for AI advertising campaigns where creative volume is high and manual review is a bottleneck.
Data warehousing and reporting:
- BigQuery + Looker Studio: for teams above $50k/month who need cross-channel reporting that isn’t dependent on platform-native dashboards.
- Google Sheets + GA4 exports: sufficient for teams under $20k/month. Simple, free, and auditable.
Scale-based decision guide:
- Under $20k/month: GA4 + Google Ads + Meta Ads Manager + Stape for server-side + POPJAM for creative pre-testing. Keep it simple.
- $20k–$100k/month: add a data warehouse, a dedicated attribution layer, and a structured experiment cadence.
- Above $100k/month: MMM becomes necessary. Platform-reported ROAS at this scale is almost always inflated by attribution overlap.
Adobe’s analysis of autonomous campaign management confirms that AI handles scale in creative testing and bidding, but humans must supply the strategic inputs: objectives, data quality, and guardrails. The tools above are only as good as the measurement foundation underneath them.
How does AI creative pre-testing actually reduce wasted spend?
The core problem with launching untested creatives is that you’re paying the platform to run your experiment for you. A typical A/B test on Meta or Google takes 14–21 days and consumes real budget to determine a winner. If you launch four variants and three of them are poor performers, you’ve funded three losing experiments at full market CPM rates.

AI creative pre-testing flips that model. You test before you spend.
POPJAM’s AI ad creative research shows that AI-generated and pre-tested creatives can deliver meaningful CTR improvements over untested variants. The mechanism is straightforward: synthetic buyer personas simulate how different psychographic segments respond to visual hierarchy, copy tone, and call-to-action framing. You get qualitative and quantitative feedback in hours, not weeks.
Here’s a practical integration pattern:
- Generate 6–8 creative variants in POPJAM using your brand assets and campaign brief.
- Run each variant through synthetic persona testing. Score them on predicted engagement and message resonance.
- Select the top 2–3 variants by score. These go into your live A/B test.
- The bottom variants are either revised based on persona feedback or discarded.
- Your live A/B now starts with pre-validated assets, which means the platform’s learning phase has better inputs and reaches statistical significance faster.
The before/after impact is measurable: teams that pre-test creatives typically enter live campaigns with a higher baseline CTR, which lowers CPM through improved Quality Score and relevance diagnostics. Lower CPM on the same budget means more impressions, more conversions, and a better ROAS without increasing spend.
Pro Tip: Fold your POPJAM pre-test scores into your experiment brief. When you document a live A/B, note the pre-test scores of each variant alongside the live results. Over time, you’ll build a calibration dataset that tells you how well synthetic persona scores predict live CTR and CPA in your specific market. That calibration makes future pre-tests more accurate.
What benchmarks should you use to set realistic targets?
Benchmarks are directional, not prescriptive. Your ROAS and CPA will vary based on category, funnel stage, creative quality, and audience temperature. Use these figures to sanity-check your performance, not to set hard targets.
| Channel / Campaign Type | Typical ROAS Range | Typical CPA Range | Key Variable |
|---|---|---|---|
| Google Search (branded) | 6x–12x | $10–$50 | Brand awareness level |
| Google Search (non-branded) | 2x–5x | $30–$50 | Competition and Quality Score |
| Meta Ads (e-commerce retargeting) | 4x–8x | $15–$60 | Audience size and creative freshness |
| Meta Ads (prospecting) | 1.5x–3x | $40–$50 | Funnel depth and LTV |
| Google Display / YouTube | 1x–2x | $50–$200 | Brand lift objective vs. direct response |
| LinkedIn Ads (B2B lead gen) | 1x–3x | $80–$200 | Deal size and sales cycle length |
Statista’s U.S. advertising spending data provides useful context for sizing seasonal budget adjustments and understanding industry-level spend patterns.
Before/after reallocation examples:
Example 1: E-commerce search campaign
- Before: $10,000/month split evenly across branded and non-branded search. Blended ROAS was below typical targets, and non-branded CPA exceeded target thresholds.
- Action: Shift a notable portion of budget from non-branded to branded campaigns. Branded ROAS: 9x.
- After: Blended ROAS improved meaningfully, resulting in increased total revenue from the same budget.
Example 2: Meta Ads prospecting vs. retargeting
- Before: A campaign mix heavily weighted toward prospecting with moderate ROAS.
- Action: Shift to a more balanced mix after identifying higher ROAS on retargeting compared to prospecting.
- After: Blended ROAS improved significantly on the same total budget.
Seasonality adjustments:
- Q4 (October through December): expect CPMs to rise 30–60% on Meta and Google as retail advertisers flood the auction. Your CPA targets should be adjusted upward proportionally, or you’ll pause campaigns that are actually performing well relative to the market.
- January: CPMs drop sharply. This is the best time to run exploratory tests and build creative libraries at lower cost.
- Back-to-school (August) and tax season (February through April) create secondary peaks in specific verticals. Build these into your monthly reallocation calendar.
How do you handle cross-channel attribution in omni-channel campaigns?
Cross-channel attribution is the hardest unsolved problem in performance marketing, and most teams are making budget decisions on data they know is wrong. Here’s how to manage it practically.
The core challenge: every platform’s native attribution model takes maximum credit for every conversion it touched. A customer who clicks a Google search ad, sees a Meta retargeting ad, and then converts via direct traffic will show up as a conversion in both Google Ads and Meta Ads.
Practical steps for omni-channel attribution:
- Use GA4 as your deduplication layer. GA4’s session-based model assigns one source per session, which gives you a conservative but consistent cross-channel view.
- Compare GA4 conversions against the sum of platform-reported conversions. The ratio tells you your attribution overlap factor.
- For channels with long consideration cycles (LinkedIn, YouTube, connected TV), last-click attribution systematically undervalues them. Use data-driven attribution in GA4 or a time-decay model to give upper-funnel channels partial credit.
- When your media budget exceeds $100k/month, invest in MMM. Tools like Google’s open-source Meridian model the incremental contribution of each channel using regression analysis on historical spend and revenue data. This sidesteps the cookie and pixel limitations entirely.
- For offline conversions (phone calls, in-store visits, sales team closes), use Google’s offline conversion import and Meta’s offline events API to close the loop between ad exposure and revenue.
The honest answer is that no attribution model is perfectly accurate. The goal is a consistent, auditable model that you apply uniformly so that relative channel performance is comparable over time. Don’t switch attribution models mid-year; you’ll lose the ability to compare periods.
What does a one-page optimization playbook look like?
Here’s a template you can copy into your team’s project management tool today.
Playbook owner: Performance Marketing Manager
Review cadence: Weekly (30 min), Monthly (90 min)
Decision triggers: CPA breach, ROAS drop, creative fatigue signal, experiment conclusion
Weekly checklist:
- Tag health audit: confirm server-side events firing in GA4 and platform dashboards
- Placement report: flag bottom three by CPA, log in shared tracker
- Creative inventory: check asset ratings in Google Ads and Meta Ads, flag “Low” assets for replacement
- Experiment status: note days remaining on active tests, flag any that have hit their run window
- Budget pacing: confirm no campaign is on track to overspend or underspend by more than 10%
- Anomaly check: review automated alerts for CTR drops, CPA spikes, or impression share losses
Monthly checklist:
- Portfolio ROAS and CPA review across all active channels
- Budget reallocation decisions: document the hypothesis, the data, and the approved move
- Creative pre-test cycle: brief new variants in POPJAM, score against synthetic personas, select top performers for next month’s live tests
- Experiment retrospective: what did we learn, what scales, what gets cut
- Stakeholder report: one-page summary of ROAS, CPA, budget moves, and next month’s plan
Embedding the playbook without extra meetings:
- Attach the weekly checklist to your existing Monday standup as a 5-minute agenda item.
- Use the monthly reallocation meeting to replace, not add to, your existing marketing review.
- Store experiment results in a shared doc that doubles as your creative performance library. Over time, this becomes your most valuable optimization asset.
Amazon Ads’ marketing optimization framework reinforces the same principle: optimization requires both creative and measurement workstreams running in parallel. Neither alone is sufficient.
A practitioner’s take on what actually works
Most teams I talk to have the same problem: they’re optimizing inside the platform instead of above it. They’re adjusting bids, swapping creatives, and tweaking audiences, but they haven’t fixed the measurement layer that tells the platform what “good” looks like. The algorithm is only as smart as the signal you feed it.
What consistently separates teams that improve ROAS quarter over quarter from those that plateau? Three things. First, they treat server-side conversion recovery as infrastructure, not a nice-to-have. Second, they run experiments with a written hypothesis and a fixed end date, not a “let’s see what happens” mentality. Third, they pre-test creatives before they go live. Not because it’s trendy, but because launching untested assets is just paying the platform to run your research for you.
POPJAM came out of exactly this frustration. Watching teams burn budget on creative variants that a 10-minute synthetic persona test would have flagged as weak, and then waiting three weeks for live data to confirm what they could have known before launch. The AI ad creative workflow isn’t about replacing creative judgment. It’s about making creative decisions faster and with better data.
Optimization is not a one-off audit. It’s a discipline. The teams that win are the ones who’ve made it a weekly habit, not a quarterly panic.
POPJAM cuts creative waste before your budget pays for it
Most ad spend waste happens before the campaign even launches. You brief a creative, it goes live, and two weeks later the data tells you what you already suspected: three of the four variants were never going to work. POPJAM changes that sequence entirely.
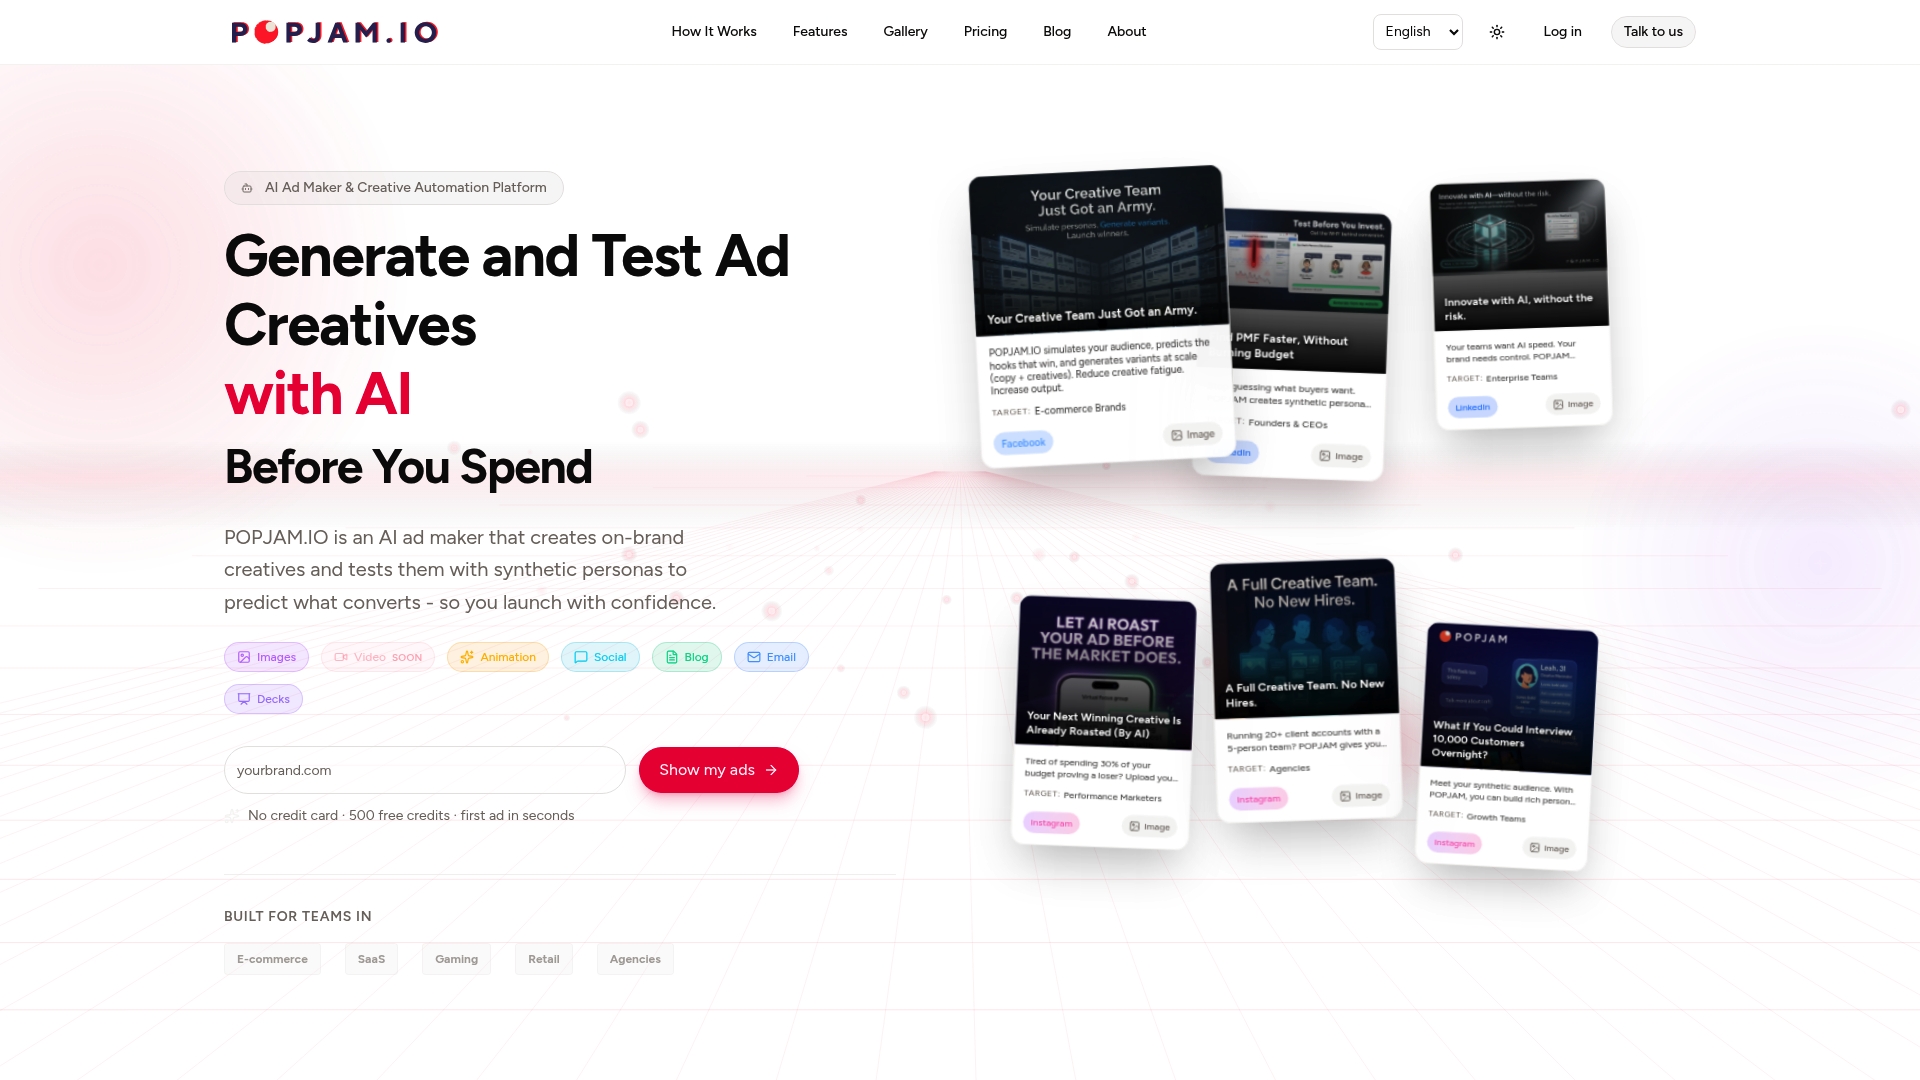
POPJAM generates on-brand ad creatives and tests them against synthetic buyer personas before a single dollar of live budget is spent. For performance marketers, that means entering every campaign with pre-validated assets. For e-commerce brands, it means faster creative cycles without the guesswork. For agencies, it means delivering better creative recommendations to clients with data to back them up, not just instinct.
The platform covers Meta, Google, TikTok, LinkedIn, and Reddit. It handles images, video, animation, social posts, and email. You get qualitative and quantitative feedback on what resonates with your specific psychographic segments, before launch.
Ready to test before you spend? Try POPJAM’s AI ad generator and see how pre-tested creatives change your campaign performance from the first day of flight.
Sources
- What is Performance Marketing & How Does it Work? | Salesforce
- Media Spend Optimization: Driving Results and Efficiency - Mailchimp
- Performance marketing – What it is, how to measure, and channels. | Adobe Business
- Ad Spend Optimization Guide: Cut Waste & Boost ROAS (2026)
- Advertising spending in the U.S. - Statista
FAQ
What is the fastest way to reduce wasted ad spend?
The fastest fix is to pull a placement-level report, identify the bottom three placements by CPA, and pause them immediately. Combined with a server-side conversion recovery setup, these two actions typically produce measurable CPA improvement within one to two weeks.

How many conversions do you need before enabling Smart Bidding?
Google recommends at least a moderate number of conversions per month per campaign before switching to Target CPA or Target ROAS. Below that threshold, manual CPC bidding with bid adjustments is more predictable and less prone to learning-phase CPC spikes.
What is the difference between ROAS and incrementality lift?
ROAS measures revenue generated per dollar of ad spend as reported by the platform. Incrementality lift measures the additional revenue that would not have occurred without the ad, using a holdout group as the baseline. ROAS can be inflated by attribution overlap; incrementality lift is the more accurate measure of true causal impact.
How does POPJAM fit into a performance marketing workflow?
POPJAM generates ad creatives and tests them against synthetic buyer personas before launch, so teams enter live campaigns with pre-validated assets rather than paying live CPMs to run creative experiments. It integrates with the experiment cadence described in this article: pre-test in POPJAM, then run only top-scoring variants in live A/B tests.
When should you use Marketing Mix Modeling instead of platform attribution?
MMM becomes necessary when your monthly media budget exceeds roughly $100k and you’re running across three or more channels. At that scale, platform-reported attribution overlap is material enough to distort reallocation decisions. MMM uses regression analysis on historical spend and revenue data to estimate each channel’s incremental contribution without relying on cookies or pixels.